National Statistics: A level and other 16 to 18 results: 2017 to 2018 (revised)

Revised information on A level and other results for 16- to 18-year-olds, including data by student characteristics.
Documents
Main text: A level and other 16 to 18 results 2017 to 2018 (revised)
PDF, 1.22MB, 39 pages

National tables: A level and other 16 to 18 results 2017 to 2018 (revised)
MS Excel Spreadsheet, 818KB
National tables: A level and other 16 to 18 results 2017 to 2018 (revised)
ODS, 660KB
This file is in an OpenDocument format
Local authority tables: A level and other 16 to 18 results 2017 to 2018 (revised)
MS Excel Spreadsheet, 380KB
Local authority tables: A level and other 16 to 18 results 2017 to 2018 (revised)
ODS, 413KB
This file is in an OpenDocument format
Maths and science tables: A level and other 16 to 18 results 2017 to 2018 (revised)
MS Excel Spreadsheet, 86.3KB
Maths and science tables: A level and other 16 to 18 results 2017 to 2018 (revised)
ODS, 64KB
This file is in an OpenDocument format
English and maths tables: A level and other 16 to 18 results 2017 to 2018 (revised)
MS Excel Spreadsheet, 324KB
English and maths tables: A level and other 16 to 18 results 2017 to 2018 (revised)
ODS, 101KB
This file is in an OpenDocument format
Minimum standards tables: A level and other 16 to 18 results 2017 to 2018 (revised)
MS Excel Spreadsheet, 110KB
Minimum standards tables: A level and other 16 to 18 results 2017 to 2018 (revised)
ODS, 77.7KB
This file is in an OpenDocument format
School and college location tables: A level and other 16 to 18 results 2017 to 2018 (revised)
MS Excel Spreadsheet, 208KB
School and college location tables: A level and other 16 to 18 results 2017 to 2018 (revised)
ODS, 200KB
This file is in an OpenDocument format
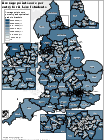
Average point score local authority map for A level students: A level and other 16 to 18 results 2017 to 2018 (revised)
PDF, 2.19MB, 1 page
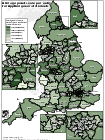
Average point score local authority map for applied general students: A level and other 16 to 18 results 2017 to 2018 (revised)
PDF, 2.13MB, 1 page
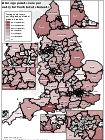
Average point score local authority map for tech level students: A level and other 16 to 18 results 2017 to 2018 (revised)
PDF, 2.13MB, 1 page

A level exam results and A level and vocational participation csv: A level and other 16 to 18 results: 2017 to 2018 (revised)
ZIP, 716KB

Quality and methodology: A level and other 16 to 18 results: 2017 to 2018 (revised)
PDF, 620KB, 28 pages

Pre-release access list: A level and other 16 to 18 results: 2017 to 2018 (revised)
HTML
Details
This statistical publication provides provisional information on the overall achievements of 16- to 18-year-olds who were at the end of 16 to 18 study by the end of the 2017 to 2018 academic year, including:
- A levels and other academic level 3 qualifications
- tech level and applied general qualifications
- level 2 vocational qualifications and technical certificate qualifications
- progress in English and maths qualifications (for students without an A* to C grade in these subjects at key stage 4)
- level 3 maths qualifications (for students with an A* to C grade in maths at key stage 4)
- level 3 value added progress and minimum standards (in revised publication only)
We published provisional figures for the 2017 to 2018 academic year in October 2018. The revised publication provide an update to the provisional figures. The revised figures incorporate the small number of amendments that awarding organisations, schools or colleges and local authorities submitted to the department after August 2018.
We have also published the 16 to 18 performance tables for 2018.
We will publish an update to this release covering the completion and attainment measure, and retention measure, in March 2019.
Attainment statistics team
Email[email protected]
Jonny Edwards 011 4274 2774
Tingting Shu 020 7340 7712
Published 24 January 2019


Responses