The introduction of T levels is the next major reform on the further education conveyor belt

The next major reform on the further education conveyor belt is the introduction of ‘T levels’ – the latest iteration of government’s full-time programme specification for 16 to 18-year-olds.
T levels will be designed with employers and will provide young people with a combination of ‘technical knowledge and practical skills specific to their chosen industry or occupation; an industry placement of at least 45 days …; relevant maths, English and digital skills; common workplace skills’.
The introduction of T levels has already become mired in a degree of controversy. In March 2017, the Chancellor announced that government would invest an additional £500m a year to support delivery of T levels once they were fully up and running.
That increase in funding was welcomed by some; others, though, wondered whether that level of additional resource would be sufficient to support the increase in programme intensity to around 900 hours.
Since then, awarding organisations have threatened – and backed away from – legal action about the way in which DfE intends to appoint awarding organisations to each T level pathway. Full implementation has been delayed beyond 2022.
Even then, the Secretary of State has been forced to issue a ‘ministerial direction’ instructing officials to implement to that timeline despite advice he received and rejected from the Permanent Secretary on risks to successful delivery on that timeline. It is hard to think of implementation red flags which have not already been waved.
The financial context in which further education colleges operate is even more challenging than the policy context. Colleges are now badly under-funded relative to the rest of the education sector.
The IFS has done some excellent work on government spending on education over time – including an analysis of spending per student over time in different parts of the education sector – which helpfully characterises the incredibly challenging financial environment in which further education colleges operate. Government spent £90 billion on education in 2017/18.That’s 4.3 per cent of national income, and second only to health as an area of government spend on public service delivery overall.
Government spending on education has increased significantly in real terms over the last 30 years – and particularly between the late 1990s and late 2000s; between 1998/99 and 2010/11, education spending grew at an average rate of around 5 per cent per year.
Since then, education spending has fallen as cuts have taken effect; between 2010/11 and 2017/18 real-terms spending fell by around 14 per cent – taking spending back to the same level it was in 2005/06.
Chart 1 shows changes in spending per student at different stages in the education system between 1989/90 and 2019/20.
Chart 1: Long-term comparison of spending per student across different stages of education
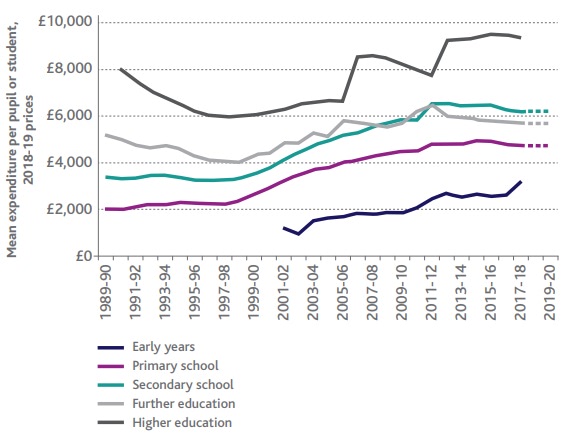
Spending in schools accounted for just under £42 billion of Government’s £90 billion spending on education in 2017/18.
In that year, per student spending at primary school was £4,700 and at secondary school £6,200. Spending rose by over 50 per cent in real terms between 2000/01 and 2010/11 and has largely been protected in real terms since 2010. Spending per student fell by 4 per cent in real terms between 2015/16 and 2017/18 but will be held constant through to 2019/20.
As a result, real-terms spend per student will be 60 per cent higher in 2019/20 that in 2000/01.49 Universities currently receive £28,200 per student to fund the cost of degree provision. This is almost 60 per cent higher than the level made available to them in 1997/98.
This increase is largely the result of substantial tuition fee reforms in 2006 and 2012 – which boosted per student resources by 28 per cent and 19 per cent respectively.
Spending on provision for 16- to 18-year-olds in further education was just under £5.8 billion in 2017/18. In that year, per student spending was around £5,700. In 1989/90, it was around £5,000 before falling by almost 22 per cent in real terms through the 1990s to a low of £4,100 in 1998/99. It then rose by nearly 60 per cent to a high of around £6,500 in 2011/12.
Further education is one of the very few areas of education spending which has not been protected from cuts since 2010.As such, since 2011/12, IFS estimates that spending has fallen by around 12 per cent in real terms.They forecast that spending per student will be constant between 2017/18 and 2019/20 – leaving spending per student at around £5,700 in 2019/20.That’s around £500 per student (10 per cent) higher than in 1989/9051.
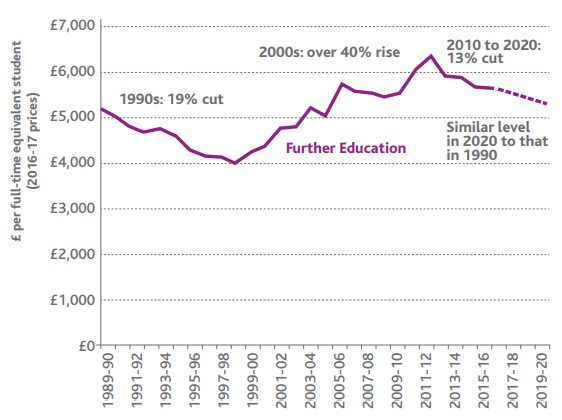
The effect of these changes – summarised in Chart 2 – is that where in 1990/91 spending per student on 16 to 18-years-olds in further education was 50 per cent higher than in secondary schools, it is now 8 per cent lower.
The IFS’s conclusion is clear: ‘16–18 education has been a big loser from education spending changes over the last 25 years’.
Chart 2: Long-term changes in spending per 16- to 18-year-old student in further education
Adult education
The story is a slightly different in relation to adult education. Here the story is one of funding cuts which have dramatically affected participation rather than per student funding. Between 2005 and 2016, the total number of adult students fell from 4 million to around 2.2 million.
This was in large part because government spending on adult education (including apprenticeships) fell by 45 per cent in real terms between 2009/10 and 2017/18.
The AoC 2018 report on college finances includes some helpful analysis of the financial pressure on colleges. It notes that funding rates for adult and 16 to 18-year-old students have been fixed in cash terms since 2009 and 2013 respectively and summarises some of the many cost pressures which colleges have faced and absorbed through that period including:staff pay rises (see below); escalating national insurance and pension costs; the introduction of the national minimum wage; and, increasing energy prices.
They compiled a ‘college price index’ (CPI) which shows how the traditional ‘consumer price index’ approach to inflation has affected colleges in recent years. Using 2015 as the reference year, their model shows the college CPI increasing from 100 in 2015 to 116.9 by 2020.
They note that for a college to absorb this level of cost pressure by finding efficiency savings will be extraordinarily difficult. To do so while also finding the resource required to invest in transformation is absurdly difficult.
What colleges are expected to deliver for the funding they receive changes often – and rarely comes with the additional resources required to meet those new expectations…
The constant changes in policy, characterised above, often ultimately translate into changes to what colleges are expected to deliver for the money they receive.
There is little evidence that when policy changes resource implications are carefully and scientifically considered, or that the funding made available to colleges is adjusted accordingly.
That is simply not how government spending processes work. HMTreasury expects the Department to fund new expectations through efficiency improvements – which in turn the Department expects of colleges.
The relationship between price and cost long since ended in messy divorce. The effect is that colleges too often receive what is known in American politics as an ‘unfunded mandate’ – a new requirement not accompanied by a fair allocation of additional resource.
The clearest recent example of such a thing is the introduction for 2015/16 of the requirement that 16–19-year-old students enrolling on a full-time course with a GCSE grade D in maths and/or English must re-sit in pursuit of an A-C grade. That change brought considerable additional costs for colleges – both in terms of implementation and operation – but no real funding.
Others in the sector will have their own favourite unfunded mandates, I am sure. Some, like the maths and English example, are obvious and substantial. Others, such as the subtle new expectations articulated with every refresh of Ofsted’s common inspection framework, can be financially innocuous on their own but add up to a genuine resource problem over time.
The effect of these unfunded mandates is obvious. Organisations must look for cost savings, efficiencies and inventive means of meeting new expectations imposed on them – whilst maintaining and improving their overall performance for the students, businesses and communities they serve.
As the overall funding position has become tighter and tighter, that has become more and more difficult to do. Precisely because so little work has been done on what it actually costs to be a college, it is very difficult to know when we passed the point at which colleges could reasonably be expected to deliver for the resources made available to them; it is very clear that that date is in the past!
These pressures also bear acutely on further education colleges’ ability to attract, retain and reward the teachers they need to deliver quality provision.
The Association of Colleges’ annual workforce survey provides useful insights as to how the pressure that colleges are under is affecting their staff. Staff turnover in colleges for 2016/17 was 17.4 per cent; 16 per cent among teaching staff. Both figures represented a fall from slightly higher levels the previous year.
All sector benchmarks are around 15 per cent so these figures are, perhaps surprisingly, not that high. More interesting is that the pressures on the sector at macro level can be seen in colleagues’ reasons for moving job within or out of the sector: ‘job change out of sector’ was cited by 30 per cent of respondents; heavy workload, 20 per cent; and low pay, 16 per cent.
Stress and mental health issues
Average absence was 5.6 days for 2016/17 compared to 5.8 days in 2015/16.Among teaching staff, the figure was 5.2 days for 2016/17. These levels are not particularly high by all-sector benchmarks.
Again, though, macro pressures on the sector are worryingly visible in colleagues’ reasons for absence. ‘Stress and mental health’ issues were cited by 80 per cent of respondents as one of the three main reasons for sickness absence.
Median pay for teachers in further education is £30,000 a year – some £7,000 less than their peers in the schools sector. In July 2018, DfE announced a 3.5 per cent pay increase for school teachers as part of a much wider announcement of pay increases for around one million public sector workers, including members of the armed forces, police service, prison officers and doctors.
It later confirmed that it would not do the same in further education. This is an example of the ways in which college’s distance from government works against them and their workforce
The combined effect of all the above is simple: running a college is hard, transforming one that is not currently performing to the standard expected means beating the odds and the system
The simplified effect of all the above funding and policy context is that colleges have been desperately trying to stretch the canvas over the frame for at least a decade. Indeed, one could reasonably argue that the frame has been getting bigger and the canvas smaller as they have been doing that.
The practical reality has been a sustained period of restructuring, staff reductions, increased workload and pressure to perform for staff who remain.
My hypothesis is that organisations that were not in a strong position at the end of 2014/15 would find it very difficult to improve their position thereafter.
That was the summer in which:
- Huge reductions in the adult education budget hit college allocations.
- Colleges stopped receiving ‘transitional protection’ funding which had been provided to help colleges adjust to their new, more austere, operating environment.
- Apprenticeship reform began to impact colleges’ financial performance, as most began to reduce the level of subcontracted apprenticeship provision they supported in preparation for its likely much-reduced role in the future market.
- The maths and English requirements were introduced, bringing with them additional teaching and administration costs.
It was also, of course, another year into the cash freeze on the unit of funding. I simply could not see how colleges would find the wriggle room required to deliver a substantive, effective transformation going into 2015/16. I say this having taken up post a few days after my organisation received its grant letter for 2015/16 – showing a huge reduction in allocation.
A simple analysis shows that I was right to be concerned.There were 89 colleges that posted an operating loss in 2014/15. Of that group, 67 moved into surplus in 2015/16. Only 26 either stayed or moved into surplus in 2016/17.
Put another way, if your college posted a loss in 2014/15 there was only a 44 per cent probability that you would stay or move into surplus in 2016/17. At the end of 2014/15, 49 colleges were rated Inadequate or Requires Improvement by Ofsted.
By the end of 2016/17, only 15 of that group had moved up to Good or Outstanding as the same organisation (10 merged or closed by the end of 2016/17). Put another way, if your college was Ofsted Inadequate or Requires Improvement at the end of 2014/15, there was only a 31 per cent probability that you would reach Good or better by the end of 2016/17.
Combining the two factors, 29 colleges posted a loss and were Ofsted Inadequate or Requires Improvement at the end of 2014/15. Only one (one!) of that group was both in surplus and Ofsted Good at the end of 2016/17 (another six merged or closed).
That is to say, if your college was loss-making and not Ofsted Good at the end of 2014/15, there was only a 10 per cent probability that you would turn around your headline position by the end of 2016/17.
Government ’s recent preference has been to merge struggling colleges with stronger neighbours. It’s too soon to say whether that approach is working…
Through the area review process, and for some years before that, government’s strong preference has been to merge struggling colleges into stronger-performing ones – typically but not always close geographic neighbours – in the belief that the stronger will be able to support the weaker to improve its position.
It is too soon to tell whether the recent wave of mergers has worked in that respect; few have been Ofsted inspected in their new formation. Indeed, as noted above, not all the mergers recommended through the area review process have yet been completed. The merits of merger as a response to organisational failure warrants a fuller discussion in its own right, once performance data is available.
I am sceptical and have prepared this piece on the assumption that transformations will continue to be required.
Matt Hamnett, Director, MH+A
Over the next few weeks FE News will be publishing this research in full, and FETL will be hosting a webinar with Matt on the report later in February.
Chapter One: The further education operating context is incredibly tough / The introduction of T levels
Chapter Two: College performance compared to other sectors
Chapter Three: The 5 causes of poor performance in FE
Chapter Four: Seven lenses of transformation for FE / FE Can Learn From The Success Of Other Sectors
Chapter Five: Good Strategy Is Crucial For FE Transformation / Policy Cycle Blights FE: Colleges Leaders Should Chart Their Own Course
Chapter Six: How to unleash the talent already in your college / Aligning organisational purpose, strategy and transformation priorities with available funding
Chapter Seven: Leading the transformation in FE
Responses