College performance compared to other sectors

Recent college performance.
The performance of further education colleges compares poorly with organisations in the wider education, health and social care sectors…
At the end of 2016/17, 13 per cent of further education colleges were rated Outstanding by Ofsted, 56 per cent Good, 29 per cent Requires Improvement and 2 per cent Inadequate.
This distribution compares poorly with the further education sector as a whole – and with other parts of the education sector; see Chart 3.
Chart 3: Distribution of Ofsted ratings for different parts of the education sector at the end of 2016/17
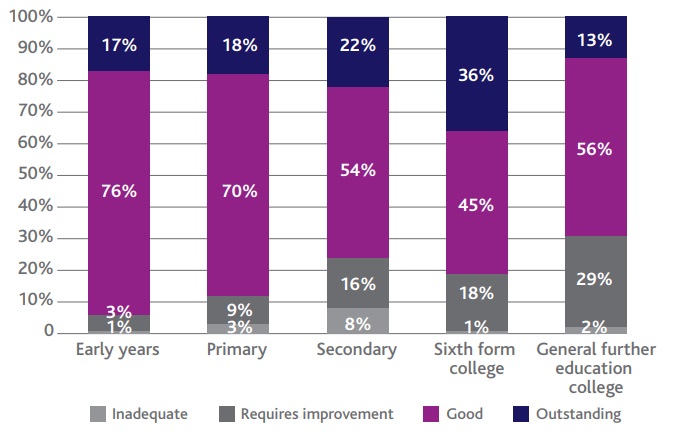
Where 31 per cent of further education colleges were rated Inadequate or Requires Improvement by Ofsted at the end of 2016/17, the figure for sixth form colleges was 19 per cent, independent training providers also 19 per cent – and for the further education sector as a whole 20 per cent. The figure for schools was 13 per cent and for early years providers, 6 per cent.
Wider comparisons are also unfavourable
Table 1 summarises the proportion of providersrated Inadequate or Requires Improvement at the end of July (health and care) or August (education) 2017 across the education, health and care sectors.
In comparing these figures, I am knowingly assuming that a Care Quality Commission (CQC) rating is broadly comparable to the Ofsted equivalent with the same label.
Table 1: Public service providers rated Inadequate or Requires Improvement at their most recent Ofsted/Care Quality Commission inspection
Sector |
% rated Inadequate |
% rated Requires Improvement |
Number rated Inadequate or Requires Improvement |
% customers supported |
| Schools | 4 | 10 | 2,884 | 13 |
| Early years | 1 | 5 | 3,332 | 5 |
| Further education & skills | 2 | 18 | 215 | 20 |
| General FE colleges | 2 | 29 | 58 | 32 |
| Adult social care | 1 | 19 | 4,255 | 20 |
| NHS acute core services | 3 | 37 | 700 | – |
| General practitioners | 2 | 6 | 490 | – |
While 31 per cent of further education colleges are rated Inadequate or Requires Improvement by Ofsted, only 20 per cent of social care providers are rated Inadequate or Requires Improvement by the CQC and 8 per cent of general practitioners.
Only NHS acute core services (i.e. hospitals) show a greater proportion of providers rated Inadequate or Requires Improvement, at their most recent inspection, than further education colleges.
While performance in other parts of the education sector is improving, further education colleges’ Ofsted performance isn’t really.
The proportion of further education colleges rated Inadequate or Requires Improvement by Ofsted had been worsening in recent years. The figure stood at 23 per cent at the end of 2014/15, growing to 29 per cent at the end of 2015/16 and then again to 31 per cent at the end of 2016/17. This trend compares poorly with other parts of the education sector, see Chart 4.
Chart 4: Proportion of education providers rated Inadequate or Requires Improvement by Ofsted since 2013.
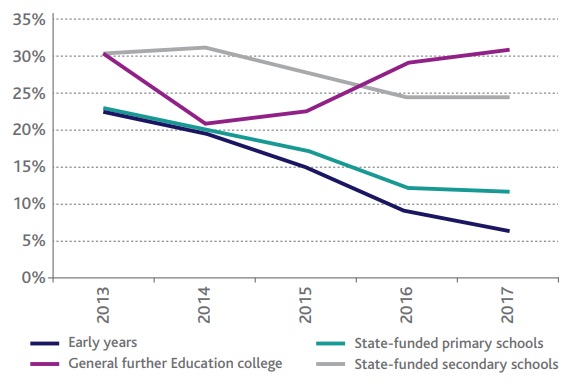
The proportion of schools rated Inadequate or Requires Improvement has been improving steadily in recent years. In August 2011, the figure was 31 per cent, falling to 24 per cent by 2013 and 19 per cent by 2015, before improving again to 14 per cent.
A similar improvement trend is evident in the early years part of the education sector. In-year Ofsted inspection data confirms the problematic trend in further education college inspection outcomes.
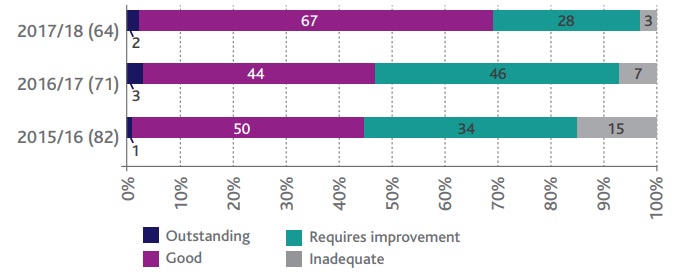
In 2015/16: Ofsted inspected 82 further education colleges; 51 per cent were rated Outstanding or Good, 34 per cent Requires Improvement and 15 per cent Inadequate.
In 2016/17: Ofsted inspected 71 further education colleges; 47 per cent were rated Outstanding or Good, 46 per cent Requires Improvement and 7 per cent Inadequate.
In 2017/18: Ofsted inspected 64 further education colleges; 69 per cent were rated Outstanding orGood, 28 per cent Requires Improvement and 3 per cent Inadequate.
Chart 5 summarises this position. While 2017/18 performance is a marked improvement on previous years, performance will need to be stronger again in future years before the proportion of further education colleges rated Requires Improvement or Inadequate compares more favourably with the rest of the education sector.
Chart 5: In-year inspection outcomes for further education colleges, 2015/16, 2016/17 and 2017/18.
Of 29 further education colleges inspected during 2016/17 that had been rated Inadequate or Requires Improvement at their previous inspection, 20 did not improve to Good or better, though eight of those previously rated Inadequate did improve – six to Requires Improvement, two to Good. Chart 6 shows the change in inspection outcomes between previous and most recent inspections for all further education colleges at the end of 2016/17.
Chart 6: Most recent and previous inspection outcomes for further education colleges at the end of 2016/17.
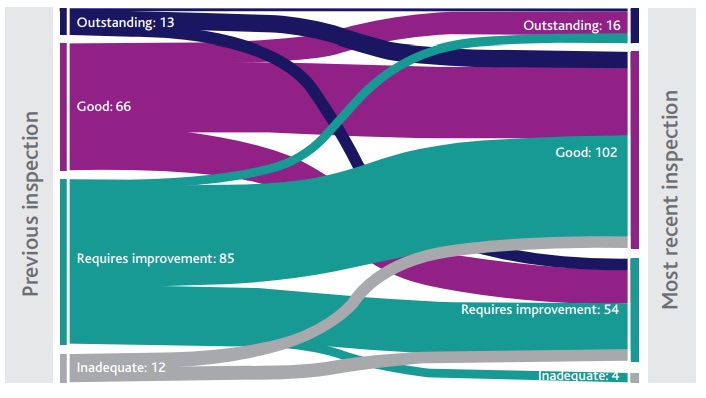
At the end of 2016/17, of the 58 further education colleges rated Inadequate or Requires Improvement at their most recent inspection, 35 had declined, 17 had stayed the same and only six had improved from their previous inspection.
Within that group of 58 colleges rated Inadequate or Requires Improvement at their most recent inspection, 27 were also rated Inadequate or Requires Improvement at their previous inspection.
This group of 27 colleges supported 202,000 learners in 2016/17, with a combined all-age achievement rate of 81.6 per cent compared to 84.4 per cent for all further education colleges.
Had their performance matched the average, an additional circa 5,500 students would have achieved in 2016/17. Looking only at 16- to 18-year-old students, those 27 colleges supported 108,000 students and had an achievement rate of 79 per cent, compared to 81.5 per cent for all colleges; had their performance matched the average, approximately 2,500 more 16-to 18-year-old students would have achieved in 2016/17.
Further education colleges’ financial performance is also poor, and getting worse.
The financial performance of further education colleges has worsened in recent years. Table 2 summarises headline measures of performance for all colleges and the subset which posted a deficit in each of the 2014/15, 2015/16 and 2016/17 academic years.
Table 2: Financial performance of further education colleges, 2014/15 to 2016/17
|
|
2014/15 |
2015/16 |
2016/17 |
| Number of colleges | 214 | 213 | 195 |
| Combined turnover (‘000) | £5,930,370 | £5,588,435 | £5,371,588 |
| Combined surplus/deficit (‘000) | -£46,415 | -£101,784 | -£141,836 |
| Combined surplus/deficit (%) | -1% | -2% | -3% |
| Combined borrowing (‘000) | £1,498,402 | £1,520,506 | £1,335,729 |
| Combined borrowing (%) | 25% | 27% | 25% |
| Number in deficit | 89 | 131 | 136 |
| Combined turnover of those in deficit (‘000) | £2,402,805 | £3,304,107 | £3,446,322 |
| Combined deficit (‘000) | -£156,837 | -£220,870 | -£238,637 |
| Combined deficit (%) | -7% | -7% | -7% |
| Combined borrowing of those in deficit (‘000) | £693,893 | £977,078 | £918,753 |
| Combined borrowing of those in deficit (%) | 29% | 30% | 27% |
The above figures are drawn from the transparency data sets which the ESFA publishes on college financial performance soon after college accounts for a given year are finalised and submitted to the ESFA.
They typically exclude information on a handful of colleges which have failed to meet their submission deadline; that’s why the total number of colleges listed above doesn’t quite reconcile with other presentations on the same.
The colleges which fail to meet the submission deadline and don’t have their information included in the transparency data sets tend to be amongst the less well-performing colleges in the pack; as such, these figures probably slightly overstate the aggregate position of the sector as a whole – excluding likely losses and debts among those at the back of the financial peloton.
With those caveats, it is unsurprising – given the operating context – that combined losses among all colleges have grown over the last three years to negative 3 per cent of turnover.
Given funding pressures, it is in many ways surprising that the position is not worse; it follows, of course, that pressures have therefore been borne by college operations and staff more than by their profit and loss accounts.
One imagines that the reduction in combined borrowings is a function of lender, rather than borrower appetite – as discussed in Chapter 1.
The ESFA rates further education colleges’ financial health Outstanding,Good, Satisfactory or Inadequate at the end of each financial year.
The ESFA does not publish these ratings – as it does with so much other data on college performance.
However, a September 2018 AoC report summarised financial health ratings amongst all colleges – including sixth form as well as general further education colleges – over the five-year period to 2017/18 (where the 2017/18 figures reflect college forecasts, rather than actual outturns).
It shows that the proportion rated Satisfactory or Inadequate has remained broadly constant at between 35 per cent and 40 per cent of all colleges – even as mergers have reduced the number of colleges being assessed. 45 per cent of colleges were not in Good or better financial health at the end of 2016/17.
Those 88 colleges shared a combined operating deficit equivalent to 6 per cent of turnover, and borrowings equivalent to 35 per cent of turnover; 74 of the 88 posted deficits for the year, and 21 had borrowings that were more than 50 per cent of turnover.
Two had borrowings which were more than 100 per cent of turnover.
There is a fairly clear correlation between poor curriculum and poor financial performance.
Chart 7 segments further education colleges by their Ofsted and financial health rating at the end of 2016/17.
Chart 7: Further education colleges segmented by Ofsted and ESFA financial health ratings
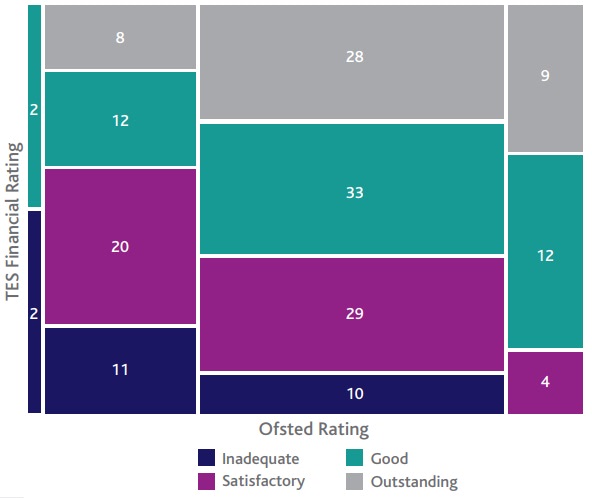
From the above, it can be seen that 33 colleges were rated both Inadequate or Requires Improvement by Ofsted, and Inadequate or Satisfactory for financial health at the end of 2016/17. Two were rated Inadequate on both measures. Only 82 colleges – 46 per cent – were rated Good or Outstanding by Ofsted and for their financial health.
Colleges are finding it increasingly difficult to navigate their way out of trouble. I want to dive deeper into the performance of colleges which are in real curriculum and/or financial distress.
The purpose of this piece is not to criticise the performance, leadership or governance of those further education colleges which found themselves in a weak position at the end of 2016/17.
The operating environment and probabilities of a successful transformation are such that it is all too easy to see how colleges might find themselves in a tough spot.
I am, however, very interested in the performance of those organisations. I want to understand the nuance of their position, and I want to understand what tends to happen in those organisations, so that I can test my thinking about what a successful transformation effort might look like against the reality of their experience.
The ESFA’s intervention policy of November 201775 defines four triggers for formal intervention in a college:
- An Ofsted inspection which judges the organisation Inadequate for overall effectiveness.
- An Inadequate assessment for financial health and/or financial management and control from the ESFA.
- Failure to meet minimum standards of performance set by the Department.
- Escalation to formal intervention following a diagnostic assessment by the FE Commissioner.
The fourth point was added to the list of triggers in November 2017, as part of an expansion in the role of the FE Commissioner. The expansion in the Commissioner’s role was in part an acknowledgement that‘greater action needs to be taken to support progress in colleges that are Ofsted Requires Improvement’. It is a helpful, partial, recognition of the need for up-stream intervention.
For the purposes of this exercise, I propose to use the following criteria to establish a pool of organisations for further analysis:
- Poor curriculum performance: Ofsted Inadequate at their most recent inspection at the end of 2016/17; or, Requires Improvement at their most recent inspection and either Requires Improvement or Inadequate at their previous inspection.This measure gives an approximation of sustained poor performance on curriculum.
- Poor financial performance: rated Inadequate for financial health by the ESFA.This measure gives a rounded approximation of sustained poor financial performance, given that it is possible, for example, to post an operating loss in a single year but still be considered to be in Good financial health, if other factors are positive
17 colleges hit the curriculum criteria and 30 the financial criteria – 39 in total.
In the next chapter, I will explore the performance of these colleges in more detail – including a detailed analysis of their performance data and Ofsted reports.
Matt Hamnett, Director, MH+A
Over the next few weeks FE News will be publishing this research in full, and FETL will be hosting a webinar with Matt on the report later in February.
Chapter One: The further education operating context is incredibly tough / The introduction of T levels
Chapter Two: College performance compared to other sectors
Chapter Three: The 5 causes of poor performance in FE
Chapter Four: Seven lenses of transformation for FE / FE Can Learn From The Success Of Other Sectors
Chapter Five: Good Strategy Is Crucial For FE Transformation / Policy Cycle Blights FE: Colleges Leaders Should Chart Their Own Course
Chapter Six: How to unleash the talent already in your college / Aligning organisational purpose, strategy and transformation priorities with available funding
Chapter Seven: Leading the transformation in FE
Responses