Post-16 education and labour market activities, pathways and outcomes (LEO)

This report looks at the post 16 education and labour market activities, pathways and outcomes of young people that took their General Certificate of Secondary Education (GCSEs) exams between 2002 and 2007.
It uses the LEO administrative data set1 to explore the pattern and nature of the pathways that people take from completing school, through their education and into the labour market.
As well as illustrating the sheer diversity of routes through education into the labour market, it also sheds light on the effects and implications of key personal socioeconomic and demographic characteristics for subsequent outcomes.
Key findings
Post 16 Education and labour market pathways are incredibly diverse
Pathways are used to show the transition from education into the labour market.
They are constructed as a set of education and labour market activities over time, starting with the first activity after KS4 (GCSEs) and ending with the most recent activity. A pathway can range from one to fifteen different activities. For example, someone who got a job immediately after GCSEs and remained employed would have a pathway simply as ‘employed’. However, most pathways contain several activities and a range of education, such as: key stage 5 (KS5), other education (at 16-19), adult further education (FE) and higher education (HE) and labour market activities (employment and benefits).
Education and labour market pathways are incredibly diverse.
For the 3.6 million individuals taking their GCSEs between 2002 and 2007 there are over 262,000 different pathways. Of these, almost 168,000 pathways are unique, i.e. each only observed for a single individual. Whilst the complexity of pathways is perhaps not surprising, clear and robust evidence on their sheer diversity did not previously exist.
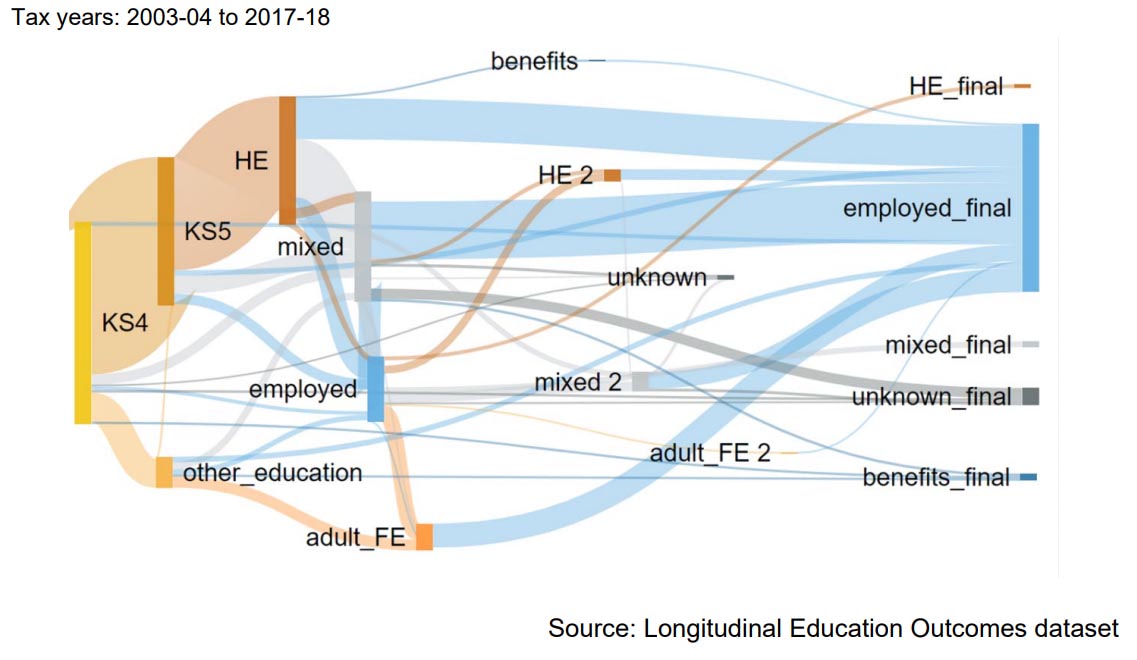
Figure 1 shows the 50 most common education and labour market pathways of all those in the sample, representing just under a third (31%) of all individuals.
The pathways move from left to right with the key activities being the nodes (the rectangular or square blocks) and the line thickness reflecting the numbers of individuals moving from one activity to the next. We can see that the most common paths pass through KS5 and HE, before ending up in employment, but that there are a variety of other activities and routes that are taken.
Figure 1: Most common education and labour market pathways of all individuals – KS4 cohorts 2001/02 to 2006/07
Post 16 Education and labour market activities, pathways and outcomes differ based on individual characteristics
The proportions participating in education (KS5, HE and other education/adult FE) immediately post-GCSE varies significantly for key sub-groups.
Similarly, the proportion in employment or claiming out of work benefits and the average earnings can differ by a large amount depending on socioeconomic, demographic and education characteristics.
Disadvantaged Individuals have worse labour market outcomes
Individuals from certain ethnic groups, who have a special education need, have poorer GCSE attainment (at KS4), are from a lower socioeconomic background or attended a state-funded (non-selective) school have worse labour market outcomes than those from more “advantaged” comparator sub-groups.
Higher levels of education lead to better labour market outcomes
Higher levels of education lead to better labour market outcomes, for all sub-groups examined and at all levels of qualification.
These comparisons are made between those with the same characteristics, for example individuals that were free school. meals (FSM) eligible with a higher education level compared to FSM eligible individuals with lower education level.
This is analysed at two levels in this report:
- Higher proportions of individuals completing a degree are in employment, having higher average earnings than those without a degree and with lower proportions claiming out of work benefits.
- Similarly, for those without a degree, individuals achieving a level 3 qualification are more likely to be employed, earn more when employed and are less likely to claim out of work benefits than those achieving level 2 or below as their highest qualification level.
For most sub-groups achieving a higher education level leads to better labour market outcomes than their comparators (with different characteristics)
Higher education leads to better outcomes for all groups when compared within groups, but how does that compare with comparator groups, i.e. those with different characteristics?
For example, comparing individuals that were free school meals (FSM)3 eligible and those non-FSM eligible with different education levels. Paragraph 6 identified that individuals with certain characteristics have poorer labour market outcomes than their comparators (with different characteristics).
In most cases, those completing a degree have better labour market outcomes than their comparators who do not have a degree.
Similarly, for non-graduates achieving a level 3 or above qualification, they usually have better labour market outcomes than their comparators who have a level 2 or below as highest education level.
For example, there are higher proportions of graduates that were FSM eligible in employment and lower proportions claiming benefits than non-FSM eligible nongraduates, 15 years after their GCSEs (63 percent versus 58 percent and five versus nine percent respectively).
Of those in employment, the FSM eligible graduates earn around £5,000 more per year than non-FSM eligible nongraduates and their earnings potential seem to have different trajectories.
Completing a degree is used as an exemplar above, but similar patterns exist for non-graduates that achieve a level 3 or above qualification.
Even with similar levels of education, there are different labour market outcomes based on individual characteristics
Flipping the previous key finding around, it implies that individuals that were FSM eligible and identified as having special educational needs (SEN) have poorer labour market outcomes than their comparators with similar education levels.
The proportions in employment, proportions claiming out of work benefits and average earnings is often different for different sub-groups with similar education levels.
This holds for comparisons between: graduates; (non-graduates) level 3 or above; and level 2 or below highest education level. The employment and earnings ‘premium’ for completing a degree or a level 3 or above qualification also differs on socioeconomic, demographic and education characteristics.
However, for a few select sub-groups a higher education level does not always lead to better labour market outcomes than their peers
For a few specific sub-groups, having a higher education level does not lead to better labour market outcomes than their peers (from different sub-groups) with a lower education level.
This is the case for those that complete a degree and for non-graduates that achieve a level 3 or above qualification. It should be noted that this is only for a few specific groups, and for the majority of sub-groups getting a degree or level 3 or above qualification is associated with better outcomes than comparators with a lower qualification.
For example, non-graduates with a statement of SEN with a qualification at level 3 or above have similar proportions in employment (both 54 percent) and claiming out of work benefits (15 versus 13 percent) as individuals not identified with SEN with level 2 or below qualifications (15 years after GCSEs).
However, despite similar levels of employment, they have lower earnings: £20,000 versus £17,000 (in year 15).
Individuals with a statement of SEN start from a lower point than their comparators, individuals not identified as having SEN (in terms of employment and earnings).
In this case achieving a level 3 does not overcome the difference (nor does getting a degree) as it does for those with SEN without a statement. On the face of it, these findings suggest that having a more severe form of SEN is a stronger influence than achieving level 3 (or a degree) on labour market outcomes. In reality, there could a combination of factors that explain this (for example, prior attainment and subject and type of study at level 3, in addition to SEN status).
Despite the above finding, achieving a level 3 or above qualification for individuals with a statement of SEN is associated with greater likelihood of gaining employment and higher average earnings when they do (compared with those achieving level 2 or below).
Conclusions and next steps
This report has several main objectives:
- Setting the scene: in terms of showing transition from school, through all post compulsory education routes and into the labour market, using a ‘whole system’ approach (i.e. not just learners completing HE or FE). Little analysis using the LEO dataset has been carried out in this manner.
- Creating new evidence: This analysis aims to fully utilise and exploit a range of variables from administrative datasets and demonstrate that education and labour market activities, pathways and outcomes differ based on them.
- Stimulate interest, debate and follow-up analysis: Crucially to encourage analysts, internal and external to the Department for Education (DfE), to follow up on the analysis. As the LEO data becomes available to the wider research community we hope that others will follow up and investigate further.
However, whilst the analysis shows ‘what’ is happening, it does not explain ‘why’.
It should be noted that these findings are descriptive and there may be other factors driving them. Other socioeconomic, demographic and education factors, and the interrelationships between them, could be explaining the findings we observe. It could also be employer discrimination. Taking differences between FSM eligible and non-FSM eligible sub-groups for instance, factors such as gender, region, first language, ethnicity and education type, quality and subject studied (as well as education level) may all have an effect. It is likely to be a complex mix of these factors that drives outcomes.
The reader should also be aware that there are a host of unobserved factors that are more difficult to capture that could be driving these findings.
Factors such as motivation, parental aspirations, innate ability, mental health and wellbeing and home learning environment cannot be derived from administrative data but are known to be important.
We are currently undertaking more technical and in-depth analysis to further investigate these findings and will publish this in the near future.
For example, regression analysis allows us to look at the association of different factors with labour market outcomes, enabling us to control for some of the aforementioned factors and isolate the relationship between the characteristics in question and labour market outcomes. This will be combined with further descriptive analysis, focusing on relationships between some of the characteristics and educational factors.
Oliver Anderson and Moira Nelson
Analysis of post-16 education and labour market activities and outcomes based on different socioeconomic, demographic and education factors:
Post-16 education and labour market activities, pathways and outcomes (LEO)
Ref: ISBN 978-1-83870-261-8, DFE-RR1125PDF, 3.48MB, 89 pages
Technical report for education and labour market pathways of individuals (LEO)
PDF, 541KB, 27 pages
Main activity tables
ODS, 781KB
This file is in an OpenDocument format
Earnings tables
ODS, 110KB
This file is in an OpenDocument format
Details
This research uses Longitudinal Education Outcomes (LEO) data to carry out analysis of over 3.6 million individuals doing their GCSEs between 2002 and 2007.
The analysis makes comparisons using the following background ‘characteristics’:
- free school meals (FSM) eligibility
- special educational needs (SEN) status
- gender
- ethnicity
- first language
- key stage 4 attainment
- school type
- region
It also observes how these differ for different education levels, doing comparisons of:
- graduates and non-graduates
- level 3 or above and level 2 or below
Published 27 May 2021
Last updated 2 June 2021 + show all updates
-
‘Post 16 education and labour market activities, pathways and outcomes’ updated.
-
First published.
Responses