The Fastest Growing Demand for Lower Skilled Jobs Across the Seven CAEHRS Regions

In the last installment of Shedding Light on the Labour Market, @EMSI_UK looked at which skills have seen the biggest percentage growth throughout this year.
In October, the Department of Work and Pensions (DWP) confirmed which organisations had been successful in tendering for inclusion in the new Commercial Agreement for Employment and Health-Related Services (CAEHRS).
The new agreements, which are set to replace the existing Umbrella Agreement for Employment and Health Related Services (UAEHRS) in January 2021, are due to run for five years and will support the provision of employment and health related services across seven different lots across the country.
These are:
- Central England
- London Home Counties
- Southern England
- North East
- North West
- Scotland and Wales.
The new CAEHRS framework comes at a critical time.
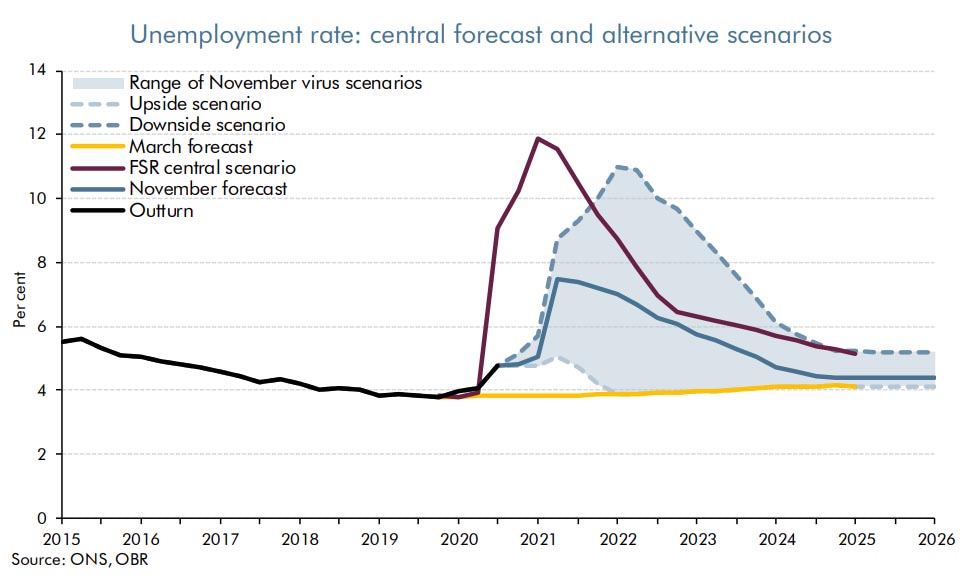
As we go into 2021, it is clear by now that there are going to be huge unemployment problems, with official estimates from the Office for Budgetary Responsibility (OBR) forecasting job losses rising to levels not seen since the 1980s, and possibly higher. It is also clear that with much of the strain being felt in sectors such as retail and hospitality, many of those being made unemployed are likely to be at the lower end of the skill spectrum.
If the organisations who have won a place on the CAEHRS are to be successful in getting people back into work, it will be critical for them to get a good understanding of which jobs at the lower skill level are in demand in the area(s) they are working in. With that in mind, we wanted to show how this can be done by taking a quick look at employer demand in each Lot region, using our Job Posting Analytics data.
Fastest Growing Demand for Lower Skilled Jobs
The slide deck below contains seven interactive charts — one for each region –, and you can toggle between these by using the arrows at the top. Each chart shows the fastest growing job demand for jobs at the lower end of the skills spectrum, which we broadly define as those within the 1-3 digit Standard Occupation Classification (SOC) groupings, from January to October this year:
There are a number of commonalities highlighted by the data:
- In all regions, we can see a contraction in demand during the period of the initial Lockdown, followed by an uptick from July onwards.
- In all regions except Wales, demand for Couriers has grown massively, particularly over the last couple of months. This is a clear reflection of the increase in demand for home deliveries during the course of the year.
- There are also a number of other jobs that have seen growth in demand across most regions, which are related to some of the changes we’ve seen this year. For example, Delivery Drivers, Warehouse Assemblers, and Forklift Truck Operators, have grown across most regions, as demand for online services and therefore warehousing has increased.
The data also highlights some specific regional nuances, and in fact there are a number of jobs that only appear in the data for one region. These are:
- Central England: Machine Operators; Labourers
- London and Home Counties: Blending Operators; Structural Fitters; Backhoe Operators
- Southern England: Potters; Shop Supervisors; Trades Helpers
- North East: Warehouse Leads; Sales Assistants; Yard Drivers
- North West: Commercial Drivers; Non-Commercial Drivers; Housekeepers
- Scotland: Driving Instructors; General Supervisors
- Wales: Driver Managers; Catering Assistants; Customer Service Advisors; Customer Service Assistants
Of course, by looking at the regions as a whole, we are only scratching the surface of our data, and it is really down at the Local Authority level that we begin to see many more of the locally specific nuances that will be vital to understand in order to see people quickly redeployed into the workforce, or being given the right retraining. But hopefully this gives an idea of the sorts of common trends in demand for low skilled jobs emerging in these regions, as well as some of the differences that the data can highlight for us.
Watch out for the final Shedding Light on the Labour Market piece of 2020 on 16th December.
To find out more about how the crisis is affecting your local area, contact Emsi for more info.
Responses