Research and analysis: The long shadow of deprivation: differences in opportunities

Report highlighting the differences in social mobility opportunities within local areas in England.
Documents
The long shadow of deprivation: Differences in opportunities across England
PDF, 5.41MB, 72 pages
This file may not be suitable for users of assistive technology. Request an accessible format.
If you use assistive technology (such as a screen reader) and need aversion of this document in a more accessible format, please email [email protected].Please tell us what format you need. It will help us if you say what assistive technology you use.
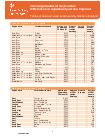
Tables – best and worst social mobility areas in England
PDF, 300KB, 1 page
This file may not be suitable for users of assistive technology. Request an accessible format.
If you use assistive technology (such as a screen reader) and need aversion of this document in a more accessible format, please email [email protected].Please tell us what format you need. It will help us if you say what assistive technology you use.

The long shadow of deprivation – technical annex
PDF, 1.48MB, 61 pages
This file may not be suitable for users of assistive technology. Request an accessible format.
If you use assistive technology (such as a screen reader) and need aversion of this document in a more accessible format, please email [email protected].Please tell us what format you need. It will help us if you say what assistive technology you use.
Details
The report finds:
- social mobility in England is a postcode lottery, with large differences across areas in both the adult pay of disadvantaged adults, and the size of the pay gap for those from deprived families, relative to those from affluent families
- disadvantaged young adults in areas with high social mobility can earn twice as much as their counterparts in areas where it is low – over £20,000 compared with under £10,000
- pay gaps between deprived and affluent young adults in areas with low social mobility are 2.5 times larger than those in areas with high social mobility
- in areas of low social mobility, up to 33% of the pay gap is driven by family background and local market factors, over and beyond educational achievement
- characteristics of the coldest spots: fewer professional and managerial occupations: fewer outstanding schools: higher levels of deprivation and moderate population density
The report calls on regional leaders to urgently tackle this social mobility post code lottery.
Published 15 September 2020


Responses