In Praise of Systems Thinking: What are “Systems Thinking” and “System Dynamics”?

FE Soundbite 793, published on 19 April, headlined the provocative question: “Can We Achieve an 80% Employment Rate With Systems Thinking in Skills and Careers Advice?”. This is related to the FE News article, Towards a Shared Vision: Reinventing Careers and Employability Support for All Ages, in which Dr Deidre Hughes OBE described Sir Charlie Mayfield’s March 2025 report Keep Britain Working Review: Discovery as “a welcome return to systems-level thinking”. The report, however, does not mention “systems thinking”, but it does have a section entitled “system dynamics”.
Is “systems thinking” the same as “system dynamics”?
And if not, what’s the difference?
I’ve been a devotee of systems thinking, and a user of system dynamics, for many years, so if these terms are unfamiliar, permit me to explain…
Systems Thinking is About the “Big Picture”
Briefly, “systems thinking” is about a willingness to examine the “big picture”, and not be deterred by complexity; to seek to understand how “things are joined up”, and not be constrained by organisational boundaries; to try to identify how cause-and-effect relationships are structured, so giving insight as to how and why an action “here” can result in something else happening “there”, perhaps much later. By understanding how complex systems actually work, we are in a much stronger position to identify how best to intervene in those systems wisely so as to achieve better outcomes.
Systems thinking is essentially qualitative, and is supported by a number of well-crafted tools and techniques, one of the most helpful being the “casual loop diagram”, of which this is an example:
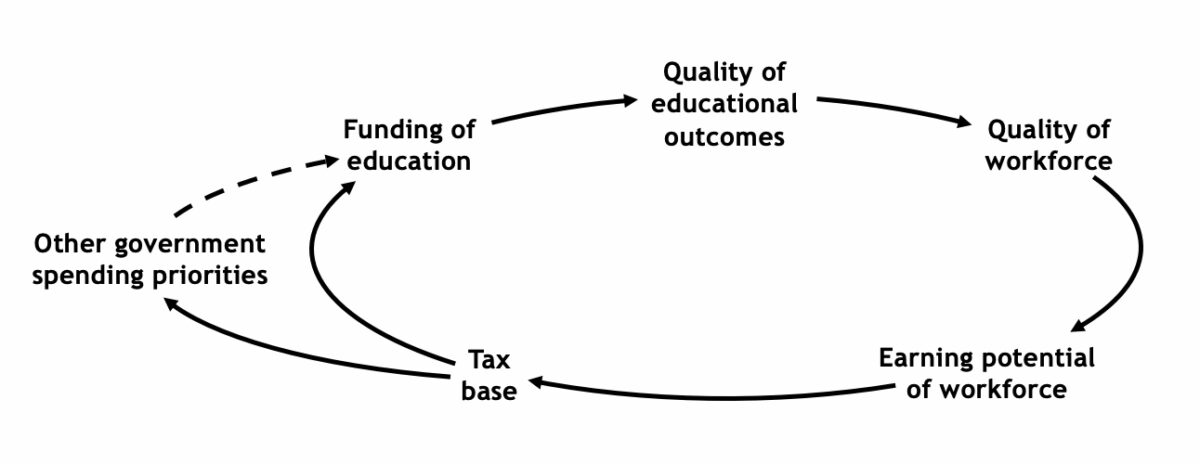
This captures my beliefs that the greater the funding of education, the better the quality of educational outcomes and therefore the quality of the workforce. This in turn enhances the earning potential of the workforce, increasing the tax base, so providing even more funds for education…
But not necessarily. The demands of other government spending priorities draw on the same tax base, and so potentially deplete the funding of education. What actually happens therefore depends on decisions defining the allocation of tax revenues across various competing priorities.
The ‘real story’, of course, is much more complex, but this is a good start. The diagram represents a sequence of cause-and-effect relationships (the quality of educational outcomes is a driver of the quality of the workforce), and the style of the connecting arrow has meaning too: a ‘solid’ arrow implies “same” (as the funding of education goes up, so does the quality of educational outcomes) whereas a dashed arrow implies “opposite” (for any given tax base, as the spending on other government priorities increases, the amount of money left for the funding of education decreases).
You’ll also see that the diagram comprises two interlinked closed loops, hence “causal loop diagram”. These two loops behave very differently. The right-hand loop (ignoring other government spending priorities) can act as a ‘virtuous circle’, with each ‘turn’ generating ever more tax, so providing ever more funding for education. Loops that exhibit this behaviour are known as “reinforcing loops”.
The action of the other loop (all the way around the outside, and in particular from tax base to other government spending priorities to funding of education), however, is to dampen things down by diverting money away from the funding of education. This type of loop is known as a “balancing loop”.
Why Systems Thinking is Important
Which leads to one of the ‘rules’ of systems thinking. A “balancing loop” is any closed loop that contains an odd number of “opposite” (dashed) links; a “reinforcing loop” is any closed loop that contains an even number of “opposite” links (with zero counting as an even number, as in the diagram above). A moment’s thought will verify that any closed loop, no matter how complex, has either an odd number of “opposite” links, or an even number. There are no other possibilities.
This has a profoundly important implication. Any causal loop diagram, no matter how complex, must be formed from just two basic elements: balancing loops and reinforcing loops. So if we can understand how those basic loops behave, we are in a very good position to understand how real, complex systems behave. And for a real, complex example, click here to see how systems thinking contributed to the Munro Review of Child Protection.
My experience is that causal loop diagrams can play an immensely valuable role in helping a community build a shared view of how a complex system actually behaves. We all have beliefs about “how the world works”, and those beliefs are important, for they determine whether I will choose [this] action rather than [that] one when taking a decision. By drawing a causal loop diagram, I can share my beliefs with you. That clarifies my beliefs, and helps you understand me better. Most importantly, you can add your beliefs too, enriching the diagram so that, together, we can build a much more complete picture. Which is then a much stronger platform from which to determine what might be done to that system to deliver better outcomes.
System Dynamics is About the Numbers
Causal loop diagrams, however, have an important limitation. Although they can give you a general ‘feel’ as to how a system might behave, they cannot answer specific questions such as “by how much must the funding for education go up so as to increase the quality of educational outcomes from [this level] to [that one], and how long will this take?”. Enter “system dynamics”, for this is the use of computer simulation models to trace how the numeric values of a system’s components might change as time progresses.
Whereas systems thinking is essentially qualitative, system dynamics takes matters further by being quantitative, with the system of interest represented by a rather different, and more detailed, form of causal loop diagram known as a “stock-flow diagram”:
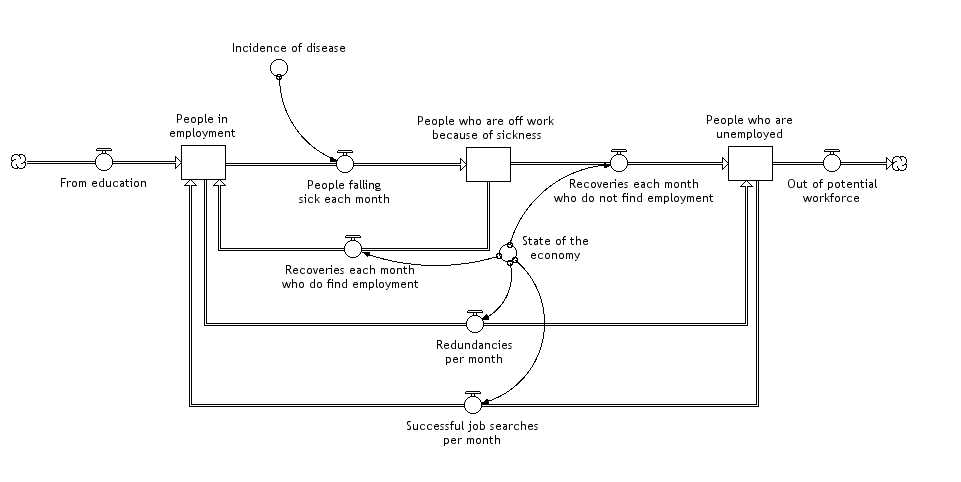
This diagram is based on Exhibit 11 in the Mayfield report, and shows how the “stocks” representing the numbers of people in employment, sick and unemployed at the end of any month are determined by various “flows”, such as the number of redundancies per month, which depletes the number of people in employment and increases the number of people who are unemployed. Also shown are just two of the (many) factors that influence the flows, the incidence of disease and the state of the economy. Using appropriate data and suitable equations defining the underlying relationships, a system dynamics simulation model can give detailed insight into the possible values of each of the modelled items as time unfolds. This is immensely valuable when it’s important to understand the numbers.
Yes, the “Systems Perspective” is Vital to Wise Policy
So, back to the original question, “Can We Achieve an 80% Employment Rate With Systems Thinking in Skills and Careers Advice?”.
To which my answer is “To me, there is no doubt that the ‘systems perspective’ – systems thinking and system dynamics together – can play a vital role in understanding the complex systems relating to employment much better, so helping identify wise ways to address this important problem. And for wise policy-making in general too.”
Written by Dennis Sherwood, an independent management consultant, and author of ‘Missing the Mark – Why so many school exam grades are wrong, and how to get results we can trust’
Responses