16 to 19: inspection data summary report (IDSR) guide

This guide gives an overview of the data in the 16 to 19 study programmes inspection data summary report (IDSR) and information to help interpret the charts.
Overview of the IDSR: 16 to 19 study programmes
The IDSR is a PDF file showing data for Ofsted inspectors to use when preparing for and during inspection. The IDSR is designed to align with our further education and skills inspection handbook, so that areas of interest can be used to identify inspection trails. The format of the 16 to 19 study programmes IDSR is consistent with the IDSRs for the primary and secondary stages of education.
The 16 to 19 IDSR was updated in January 2021 and includes 2019 revised and final Department for Education (DfE) school and college performance tables data. Value-added, attainment and English and mathematics progress measures are based on revised data. Final data is used for retention and completion and attainment measures. The destinations measures have now been updated with the provisional data for destinations of learners in the academic year 2018 to 2019, which was released by the DfE in November 2020.
For further education and skills providers with only 16 to 19 provision, the 16 to 19 study programmes IDSR is provided as a standalone document. If a school has younger pupils in earlier key stages as well as 16 to 19 provision, the IDSRs are combined. The 16 to 19 provision pages come after those that relate to primary or secondary key stages.
IDSRs are available through DfE sign-in.
The IDSR is a PDF file showing data Ofsted inspectors use for inspections. It aligns with our education inspection framework.
You can get your IDSR by logging into your DfE Sign-in account:
- go to Analyse School Performance (ASP)
- click on ‘All reports’
- select ‘Ofsted inspection data summary reports’
- click ‘Visit the Ofsted IDSR service’ to download your school’s report
Sign-in: Analyse School Performance
Supporting data tables used for the 2019 IDSR show national figures and quintile boundaries that trigger areas of interest sentences.
IDSR 2019
We have re-developed the IDSR following the introduction of the new education inspection framework (EIF). The new IDSR contains less data and has reduced in size.
FES example inspection data summary report
PDF, 252KB, 10 pages
This file may not be suitable for users of assistive technology.
If you use assistive technology (such as a screen reader) and need aversion of this document in a more accessible format, please email [email protected].Please tell us what format you need. It will help us if you say what assistive technology you use.

Percentile Boundaries 2019
ODS, 61.8KB
This file is in an OpenDocument format
The new IDSR has been designed to:
- reduce the time spent preparing for an inspection
- provide interpretation of the data for inspectors
- minimise the focus on small groups that distract the conversation away from meeting the needs of all learners
The IDSR continues to contain areas of interest sentences to highlight important data trends and differences to national data.
Report information
The IDSR will always show which data release the report is based on. It will also show the date the report was last released, for example: 2019 key stage 5 – release date: January 2021.
Conditions of use
The IDSR conditions of use and storage are that:
- the IDSR is to be used only for educational and analytical purposes and for informing inspection, not for any other purpose
- data presented in the IDSR is to be shared only with those who need and are authorised to have access to the information
- only nominated users may access the IDSR and these users must be made aware that they cannot share the IDSR without permission from the data owner
- the IDSR should be saved in a secure location with limited access
Data protection
When accessing the data in the Ofsted IDSR service, you must recognise the privacy of that data and always comply with the Data Protection Act 2018. The Data Protection Act 2018 is the UK’s implementation of the General Data Protection Regulation (GDPR). You must ensure that you use the data that you have access to for the purpose for which the service was set up and that you do not use the data for any other purpose. You must ensure that the data is processed securely and that it is not subject to any unauthorised use or disclosure.
Provider context
Coverage estimation
Coverage estimation estimates the proportion of learners at the provider included in the IDSR, which indicates the weight that it should have in assessing provider performance. This is especially relevant for general further education colleges.
To calculate the coverage estimation, unique learners in the IDSR are identified and aggregated. This total is then divided by the cohort provided in the Individualised Learner Record (ILR) funding R14 return for 2018/19. The calculation is as follows:
To count in the IDSR cohort, learners must be studying one or more of the following qualifications:
- A levels
- other academic
- applied general
- tech level
- level 2 technical certificate
Learners will also be included in the IDSR cohort if they are part of the English and mathematics progress measure.
To be included in the final ILR cohort, learners must be recorded as undertaking one or more of the following in 2018/19:
- apprenticeships
- education and training
- community learning
Coverage estimation is presented as a single sentence. It will show the following, where we estimate the IDSR cohort in bands of 5%.
We estimate that between x% to x% of the total learners at this provider are included in the IDSR.
Only providers with data in the final ILR return will have a coverage estimation. For other providers, such as school sixth forms, the following sentence will appear:
Coverage estimation is not available for this provider.
Funding allocation
A sentence is included here which states the proportion of funding allocated to the provider that is for 16 to 19 study programmes, out of the total funding the provider receives. Note that this total funding does not include levy-funded apprenticeships. If funding data is not available, the sentence ‘No funding allocation data available for 2018/19’ will be generated instead.
Qualification type cohort
This table lists the number of learners undertaking each type of qualification.
Learners may be working towards more than 1 type of qualification and so may be counted more than once. Learners taking courses that are not full qualifications are not included. Learners taking academic qualifications other than A levels are not included in the table under individual qualification types but are included in the total. Therefore, the numbers in each row may not add up to the total number of learners and percentages may not add up to 100.
The number and proportion of learners who are not taking any approved qualification is also included in the table. Below the table is a sentence stating the proportion of vocational learners taking approved applied general and tech level qualifications. The DfE’s guidance on technical and vocational qualifications gives the list of approved qualifications.
Areas of interest
The ‘areas of interest’ in the IDSR are sentences providing inspectors with interpretation of a provider’s historical data. A sentence may be ‘triggered’ by high or low performance, either across 2 years or in the latest year.
A sentence shown in grey may also appear when the provider’s data is not high or low, for example, if progress scores are not statistically significant. These are included to show inspectors that the data has been analysed but that the historical data is not an area of interest.
Sentences are not produced when either the number of learners or entries is fewer than 11.
Sentences referring only to the latest year will only be generated for a measure when there are no sentences generated in relation to that measure which refer to the previous 2 years.
The top and bottom percentages are determined using percentiles. These divide the provider population into 100 equal groups according to the distribution of values of a particular variable, with approximately 1% of the providers held in each. Any value that falls within the first 10 percentiles will be flagged as in the lowest 10% of all providers nationally.
Level 3 value added sentences
There can be multiple sentences if your provider fits the criteria of each sentence.
Each sentence outlined below will only appear if they have ‘triggered’ for your provider.
A sentence will flag when there is consistently significant high or low progress in A level, AS level or applied general qualifications for the last 2 years, or when there is significantly higher or lower progress in the latest year based on statistical significance and percentile rank.
Example sentences
The value-added score for AS level was significantly below the national average and in the lowest 20% in both 2018 and 2019.
In 2019 the value-added score was significantly below the national average and in the lowest 10% in A level and applied general.
Level 3 value added by subject sentences
There can be multiple sentences if your provider fits the criteria of each sentence.
Each sentence outlined below will only appear if they have ‘triggered’ for your provider.
A sentence will flag when there is consistently significant high or low progress in the same subject for the last 2 years, or when there is significantly very low progress in the latest year based on statistical significance and percentile rank.
Example sentences
The value-added score for qualifications of A level size and above was significantly below the national average in both 2018 and 2019 for the following subjects: Biology, History, Geography.
The value-added score for qualifications of applied general was significantly above the national average in both 2018 and 2019 for the following subjects: VRQ 0.5 – Finance, BTEC Nat Cert – Health studies.
In 2019 the value-added score for qualifications of applied general was significantly below the national average and in the lowest 5% for the following subjects: BTEC Nat Cert – Business stds.
Completion and attainment sentences
There can be multiple sentences if your provider fits the criteria of each sentence.
Each sentence outlined below will only appear if they have ‘triggered’ for your provider.
A sentence will flag when there is consistently high or low progress in tech level (L3) qualifications or technical certificates (L2) for the last 2 years, or when there is higher or lower progress in the latest year based on percentile rank.
Example sentences
The completion and attainment score in technical certificate (L2) was in the highest 20% in both 2018 and 2019.
In 2019, the completion and attainment score was in the lowest 10% in tech level (L3).
English and mathematics progress sentences
There can be multiple sentences if your provider fits the criteria of each sentence.
Each sentence outlined below will only appear if they have ‘triggered’ for your provider.
A sentence will flag when the average progress score is at least three quarters of a grade above or one third of a grade below the national average progress score. It will also flag if the percentage who gained grade 4 or above or the percentage entered was significantly above or below the national rate. This is based on statistical significance and shown only for the total learner cohort.
Example sentences
The average progress score in maths was at least three quarters of a grade above the national average.
The percentage of learners in maths who were entered is significantly above the national rate.
Attainment sentences
There can be multiple sentences if your provider fits the criteria of each sentence.
Each sentence outlined below will only appear if they have ‘triggered’ for your provider.
A sentence will flag for a particular qualification type when the provider’s attainment score is in the highest or lowest 20% in both 2018 and 2019. A sentence will also flag for a particular qualification type if the attainment score is in the highest or lowest 10% in the current year. Note that this sentence will only be triggered when a previous sentence does not apply. These sentences are based on percentile rank.
Example sentences
Average point score per entry for A level and AS level was in the lowest 20% in both 2018 and 2019.
The average point score per entry was in the lowest 10% for applied general in 2019.
Retention sentences
There can be multiple sentences if your provider fits the criteria of each sentence.
Each sentence outlined below will only appear if they have ‘triggered’ for your provider.
A sentence will flag for a particular qualification type when the percentage of learners retained for a provider is in the bottom 10%. A sentence will also flag for a particular qualification type if the provider retains 100% of their learners. For level 3 qualifications, sentences are flagged based on retained for a second year. For level 2 technical certificates, sentences are flagged based on retained and assessed.
Example sentences
The percentage of learners for second year was in the lowest 10% for A level and applied general.
All students were retained and assessed in technical certificate (L2).
Destinations sentences
The sentence outlined below will only appear if it has ‘triggered’ for your provider.
A sentence will flag when the proportion of learners who went on to a sustained positive destination (sustained education or employment/training) is statistically significantly higher or lower than the national figure.
Example sentence
The proportion of learners who went into sustained education or employment/training was significantly higher than national.
Learner groups sentences
Learner group differences can be meaningless when analysed at provider level, particularly if groups relate to small cohorts. The conversation should be about meeting the needs of all learners.
Because of this, sentences related to learner groups will only appear for a given measure when:
- the performance of the group differs from that of the whole group of learners at the provider
- no sentences about the measure have already been ‘triggered’ for the provider in the earlier subsections
The learner groups shown depend on the performance measure, as detailed below.
Disadvantaged learners are shown as a learner group for the following measures:
- destinations
- value-added data relating to A level, AS level and applied general qualifications
- completion and attainment data relating to tech level qualifications and technical certificate qualifications
Prior attainment learner groups are shown for some measures. These groups are based on learners’ average points score at key stage 4, which is calculated by giving a points score to each grade and taking an average across all the learner’s grades. The following table shows the corresponding points scores for each grade.
| GCSE grade (old grading structure) | Points score |
|---|---|
| A* | 8.5 |
| A | 7 |
| B | 5.5 |
| C | 4 |
| D | 3 |
| E | 2 |
| F | 1.5 |
| G | 1 |
| U | 0 |
Note that in 2017, 2018 and 2019, points were allocated to new GCSEs (with grades of 9 to 1). The DfE’s secondary accountability measures guidance contains further details on how these scores are calculated.
In the IDSR, we use groups of scores. For level 3 learners, these are as follows:
- learners with prior attainment grades 7–9 (equivalent to grades A*–A under the old grading structure)
- learners with prior attainment grades 4–6 (equivalent to grades B–C under the old grading structure)
- learners with prior attainment grades 3 and under (equivalent to grades D–G under the old grading structure)
To align learners’ average points scores to these groups, we calculate an upper bound and lower bound for each group.
To calculate the upper bound for each group, we calculate the midpoint between the maximum points score within the group and the minimum points score within the next highest group.
For example, to calculate the upper bound for the 4–6 group, we take the midpoint between the maximum points score for the 4–6 group (5.5) and the minimum points score for the 7–9 group (7):
Upper bound = (5.5 + 7) / 2 = 6.25
Similarly, to calculate the lower bound for each group, we calculate the midpoint between the minimum points score for the group and the maximum points score for the next lowest group.
For example, to calculate the lower bound for the 4–6 group, we take the midpoint between the minimum points score for the 4–6 group (4) and the maximum points score for the 3 and under group (3):
Upper bound = (3 + 4) / 2 = 3.5
These calculations produce the following average points score boundaries.
| GCSE grade group | Average points score boundaries |
|---|---|
| 7–9 | 6.25 and above |
| 4–6 | 3.5–6.25 |
| 3 and under | 0–3.5 |
For level 2 learners, we follow an equivalent process to calculate average points score boundaries for the following groups.
| GCSE grade group | Average points score boundaries |
|---|---|
| 3-9 | 2.5 and above |
| 2 | 1.25–2.5 |
| 1 and under | 0–1.25 |
For value-added data relating to A level, AS level and applied general qualifications, and completion and attainment data relating to tech level qualifications, the following groups based on prior attainment for level 3 learners are shown:
- learners with prior attainment grades 7–9 (average points score of 6.25 or higher)
- learners with prior attainment grades 4–6 (average points score of 3.5 or above up to, but not including, 6.25)
- learners with prior attainment of 3 and under GCSE point score (average points score below 3.5)
For completion and attainment data relating to technical certificate qualifications, disadvantaged learners and the following groups based on prior attainment for level 2 learners are shown:
- learners with prior attainment grades 3–9 (average points score of 2.5 or higher)
- learners with prior attainment grade 2 (average points score of 1.25 or above up to, but not including, 2.5)
- learners with prior attainment grade 1 and under (average points score below 1.25)
If performance does not differ from that of the provider, no sentences will appear.
Learner context
Learner characteristics (end of key stage 4)
This table shows the following measures:
- the percentage of learners who were disadvantaged
- the number of learners who were looked after
- the percentage of learners with special educational needs (SEN)
- the percentage of learners with a SEN statement or an education, health and care plan (EHC)
- the percentage of learners with English as an additional language (EAL)
The data relates to learners’ characteristics at the end of key stage 4.
Disadvantaged learners are those who were eligible for free school meals at any time during the last 6 years and children looked after (in the care of the local authority for a day or more or who have been adopted from care).
GCSE English and mathematics
This text lists the number of 16 to 19 learners who did not achieve GCSE grade 4 or above in English or mathematics or both at the end of key stage 4. The 3 figures are calculated separately, so a learner counted in the ‘both’ figure will also be counted towards the other figures.
Ethnicity
The text states the largest 5 ethnic groups with more than 5% present in the provider.
Below this is a sentence stating how many ethnic groups are present in the school out of 17.
The 17 possible ethnic groups are:
- White British
- White Irish
- White Traveller of Irish Heritage
- White Gypsy/Roma
- White Any other White background
- Mixed White and Black Caribbean
- Mixed White and Black African
- Mixed White and Asian
- Mixed Any other Mixed background
- Asian or Asian British Indian
- Asian or Asian British Pakistani
- Asian or Asian British Bangladeshi
- Asian or Asian British Any other Asian background
- Black or Black British Caribbean
- Black or Black British African
- Black or Black British Any other Black background
- Chinese
This excludes the groups ‘Any other ethnic group’, ‘Parent/pupil preferred not to say’ and ‘Ethnicity not known’.
Prior Attainment
This table shows the spread of average prior attainment of learners at the end of key stage 4. For learners studying A levels, this is based on GCSEs only. For learners studying applied general and tech levels, all approved qualifications are included. The earlier ‘Learner groups’ subsection describes the calculation, which refers to average prior attainment and does not indicate the highest grade or the number of qualifications a learner attained.
Note that the prior attainment groups used here are different to those used in the ‘Learner groups’ section. Here the following groups are used:
- learners with prior attainment grades U–2
- learners with prior attainment grade 3
- learners with prior attainment grade 4
- learners with prior attainment grades 5–6
- learners with prior attainment grades 7–9
Entries in the table are marked by colour to indicate if they are statistically significantly different from the national figures. The ‘Statistical significance’ subsection gives further details on significance calculations.
Trends over time for study programmes
This section shows how the provider has performed compared with other providers overall and for each qualification type over the last 3 years.
The provider’s position is indicated in terms of quintiles, where each quintile represents 20% of providers. Q5 represents the bottom 20% of providers and Q1 represents the top 20%. Caution should be taken when considering movement across 1 quintile, because this may reflect a relatively modest change in score taking the provider over a boundary.
Provider scores are shown on the boxes. The score is relative to national progress, where a score of 0.0 indicates average progress. Red boxes indicate if the score was statistically significantly below the national average. Green boxes indicate if a score was statistically significantly above the national average. The ‘Significance calculation on level 3 value added’ subsection gives further details on these significance calculations.
The brackets show the corresponding number of entries or aims for the provider. These are displayed in grey when they are 10 or fewer.
Level 3 value-added data is shown for A level, AS level and applied general qualifications. Completion and attainment data is shown for tech level qualifications (L3) and level 2 technical certificates.
The ‘A level’ group includes the following A level qualifications:
- A level
- applied A level single award
- applied A level double award
The ‘AS level’ group includes the following AS level qualifications:
- AS level (not continued to full A level)
- applied AS level single award
- applied AS level double award
For reference, the ‘A level group’ DfE report combines these 2 groups together.
Understanding the data
The level 3 value-added measure shows the progress each student makes between key stage 4 and graded level 3 qualifications (excluding tech levels), compared with the actual progress made by students nationally who had similar levels of attainment at key stage 4. Students are compared with other students studying the same qualification nationally before being aggregated to give an overall score for a provider. This score is expressed as a proportion of a grade above or below the national average. For example, a score of -0.5 means students achieve half a grade lower across their qualifications than the national average for those with similar starting points.
The completion and attainment measure compares the attainment of students with the national average attainment for each qualification. It treats non-completion of the course as a fail. The scores for each qualification are aggregated to give an overall score for each provider, expressed as a proportion of a grade above or below the national average.
Significance calculation on level 3 value added
Confidence intervals are calculated on the value-added scores and these are used to calculate the statistical significance. The DfE’s 16 to 18 accountability measures technical guide details the information required to perform confidence interval calculations.
Statistically significantly below the national average is defined as when the value-added score is below 0 and the upper end of the 95% confidence interval is below 0. Statistically significantly above the national average is defined as when the value-added score is above 0 and the lower end of the 95% confidence interval is above 0.
English and mathematics progress
This page shows the progress made by learners who did not achieve at least a grade C (grade 4 in the reformed grading system) in English and/or mathematics by the end of key stage 4. English progress is highlighted in the first table and mathematics in the second.
The rows in each table split learners into the highest grades they achieved at the end of key stage 4, known as their starting point or prior attainment. The second row shows learners who attained GCSE grade D (grade 3 in the reformed grading system) or equivalent level 2 qualifications at the end of key stage 4. The row above it shows learners who achieved anything other than this, that is, learners who have ‘all other grades’ at key stage 4 as their prior attainment. The final row in each table (‘Total’) displays learners from all starting points.
For English, the ‘all other grades’ prior attainment category includes learners who obtained the following:
- Fail, that is, no qualifications
- Entry level and level 1 ESOL (English for Speakers of Other Languages) and functional skills, which includes ESOL level 1 and entry level and functional skills level 1 and entry level
- GCSE grades F to G, which includes reformed GCSEs (grade 1) and legacy GCSEs (grades F to G)
- GCSE grade E, which includes reformed GCSEs (grade 2) and legacy GCSEs (grade E)
For English, the ‘GCSE grade D and level 2 ESOL and functional skills’ prior attainment category includes reformed GCSEs (grade 3), legacy GCSEs (grade D), ESOL level 2 (all grades) and functional skills level 2 (all grades).
For mathematics, the ‘all other grades’ prior attainment category includes learners who obtained the following:
- Fail, that is, no qualifications
- Entry level and level 1 functional skills, use of mathematics and FSM (free standing mathematics), which includes free standing mathematics level 1 and entry level, functional skills level 1 and entry level and AQA use of mathematics (grades D to G)
- GCSE grades F to G, which includes reformed GCSEs (grade 1) and legacy GCSEs (grades F to G)
- GCSE grade E, which includes reformed GCSEs (grade 2) and legacy GCSEs (grade E)
For mathematics, the ‘GCSE grade D and level 2 functional skills and use of mathematics and FSM’ prior attainment category includes reformed GCSEs (grade 3), legacy GCSEs (grade D), free standing mathematics level 2 (all grades), functional skills level 2 (all grades) and AQA use of mathematics (grades A*/A/B/C).
The columns in the IDSR tables provide a range of measures about the extent to which the learners made progress. Use caution with percentages from these tables because they are often based on a small number of learners. Colour boxes around the average progress score (for total learners only) indicate how this figure compares to the national figures. The keys at the top of the tables give further details.
Each table shows the following information:
- the number of learners in scope, that is, learners who did not achieve a GCSE grade A*–C or 9–4 or equivalent by the end of key stage 4 in that subject (note that some exclusions apply and are detailed below)
- the percentage of learners who attained grade C (grade 4) or above at the end of their 16 to 19 study programme
- the percentage of learners who improved their grade from key stage 4
- the average progress score
- the percentage of learners entered for an approved English or mathematics qualification
The denominator for all measures is the number of learners in scope.
The average progress measure subtracts a learner’s post-16 performance from their prior attainment at key stage 4. Negative scores are capped at -1. For example:
- if an individual student moves from an E grade to a C grade they would receive a progress score of +2 because they have made 2 grades’ progress
- if the student moves from an E grade to a G grade, their progress score would be capped at -1
The DfE’s 16 to 18 accountability measures technical guide under section 7 includes further details about these measures, including learners excluded from the calculations.
Retention
This section provides data on the extent to which a provider retains learners to the end of the main learning aim of their study programme.
From 2019, only technical certificates will be recognised as level 2 vocational qualifications in the 16 to 18 performance tables. In 2017 and 2018, the DfE reported a broader range of qualifications. The DfE’s guidance on technical and vocational qualifications contains the lists of qualifications that count in 2019 performance tables.
Data is presented for 4 study programmes:
- A levels (including AS level)
- level 3 applied general
- level 3 tech level
- level 2 technical certificate
A learner’s study programme is defined based on their main aim. The DfE’s 16 to 18 accountability measures technical guide provides further information on how this is defined.
Data is presented for 3 retention measures for each qualification type, as detailed below.
Learners are counted in the retained measure if they have completed all learning activities for their main aim.
Learners are counted in the retained for a second year measure if they have returned to the same provider for a second year of study and are retained in their second year. This measure is not available for level 2 technical certificates because many of these programmes are not expected to be 2 years long.
Learners are counted in the retained and assessed measure if they are retained to the end of their course and are assessed. The assessment may not necessarily be in the same subject or type of qualification they were aiming for when their studies began. However, the assessment must be at the same level and at least the same size as the main aim. For example, a student with an original main aim of tech level at size 1 would be considered as retained and assessed with an applied general exam result of at least size 1.
The IDSR shows the number of learners who are eligible for each measure and, in square brackets, the number of learners who were not retained.
Attainment
The attainment section shows 6 charts. The 3 charts on the top row focus on A level qualifications and use 3 different attainment measures as detailed below.
Average progress score (APS) per entry is calculated by dividing the total number of points achieved by learners by the total size of entries for those learners. This is then aggregated to give an overall APS score for a provider. Entries are based on the size of the qualification and learners may contribute multiple qualifications to the measure. Learners may also be counted in more than 1 qualification type.
The best 3 A levels score is calculated by adding together the points achieved by learners in their best 3 A levels and summing this score across a provider. This is then divided by the number of eligible students and divided by 3 to get the overall score for a provider. The DfE’s 16 to 18 accountability measures technical guide provides details on which learners are included in this measure.
A level AAB % shows the percentage of learners who have achieved 3 A levels at grades AAB or better, of which at least 2 are in facilitating subjects. The facilitating subjects are:
- biology
- chemistry
- physics
- mathematics
- further mathematics
- geography
- history
- English literature
- classical/modern languages
The 3 charts on the bottom row show APS for other qualifications: applied general, tech levels (level 3) and technical certificates (level 2).
Each chart shows the last 2 years of data and presents scores as quintiles. There is a clear indication of the position in terms of the quintile, where each quintile represents 20% of providers. Q5 is the bottom 20% and Q1 is the top 20%. Caution should be taken when considering movement across 1 quintile, because this may reflect a relatively modest change in score taking the provider over a boundary.
Destinations
This table shows the proportion of learners who completed their study programme at the provider who went on to sustained education or employment, who went on to a destination not sustained or whose activity was not captured. It further shows what proportion of all learners went on to an apprenticeship, to any education and to higher education. In most cases, this data relates to learners who completed 16 to 19 study programmes in 2018. The DfE’s 16 to 18 accountability measures technical guide contains further information on the methodology.
Different rows show data for learners who studied at level 3, at level 2 and at entry/level 1 and other.
If data has been suppressed due to small cohorts, an ‘x’ will be shown in the table.
This data is taken from the DfE source ‘Destinations of KS4 and 16 to 18 (KS5) students: 2019’, which includes full definitions of the measures used and further breakdowns of the data.
Level 3 value added by subject
This section shows subjects listed in descending order based on the number of entries for the provider in the most recent year. For each subject when the provider had at least 1 entry in the latest year, the number of entries is shown for the most recent and the previous year. A dash will be shown if there are no entries in the previous year. Data based on ten or fewer entries is displayed in grey.
Red boxes indicate if the value-added score was statistically significantly below the national average. Green boxes indicate if a value-added score was statistically significantly above the national average. The ‘Significance calculation on level 3 value added’ subsection gives further details on these significance calculations.
A level size subjects are listed on the left. This covers the following qualifications:
- A level
- applied single award
- applied double award
- pre-U principal
- international baccalaureate
Applied general subjects are listed on the right.
Understanding the data in the 16 to 19 study programmes IDSR
Statistical significance
Assessment data and information are starting points for inspectors’ discussion with providers. Statistical significance testing is used in the IDSR to draw attention to noteworthy values. These values show where differences in providers’ performance may be due to more than chance variation. The IDSR uses percentile ranking as well as statistical significance testing. This allows us to look at relative performance across time while also highlighting noteworthy changes.
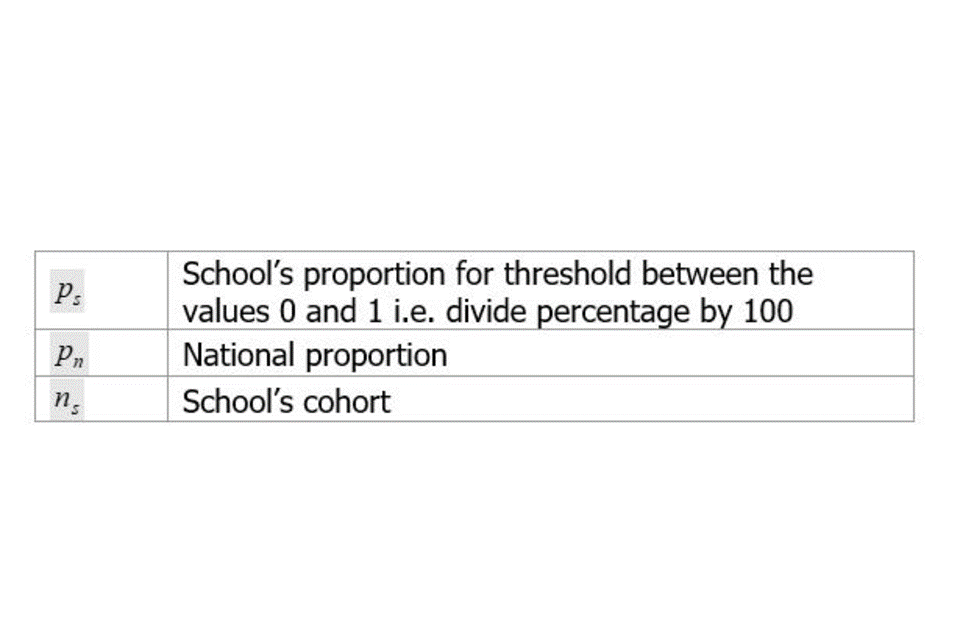
Significance calculation for threshold measures
A normal approximation to the binomial distribution is used to identify statistically significant differences between proportions of pupils (shown in the areas of interest). When both of the following conditions are satisfied, we carry out the calculation below.
nP
and
n(1-P)
are greater than 5.
Where:
- P represents the national average of pupils reaching the expected standard
- n represents the total number of pupils
The calculation is as follows:

Otherwise not statistically significant.
Where:
This methodology is applied to the following performance measures:
- prior attainment
- English and mathematics progress (for ‘percentage that gained grade 4 and above’ and ‘percentage entered’)
- destinations
Data presentation
The IDSR contains data for context, valued-added progress, completion and attainment, retention, English and mathematics progress and destinations.
The IDSR generally reports performance data on learners in the provider where they ended their 16 to 19 learning, which may differ from the provider they started at. The DfE’s 16 to 18 accountability measures technical guide contains further technical details on performance data and its coverage.
The IDSR is best viewed in colour, either on screen or printed. All performance data based on 10 or fewer learners/entries is displayed in grey throughout the report. Averages and percentages for these small cohorts are more affected by the performance of individual learners and so should not be given undue weight.
Missing data
There are a few possible reasons why data for some years is not shown for a particular measure.
In charts and tables, data may not be shown for some years because:
- the measure did not exist, was defined differently or was not available to Ofsted for that year; if this is the case, the data is shown as a dash
- the provider had no learners for a particular measure in that year; if this is the case, the cohort will be shown as a 0 and a dash will be shown for the measure
- the provider may have recently changed as a legal entity (for example, as a result of a merger)
‘−’ is used to indicate where data is missing or not applicable. ‘x’ is used in the destinations section to indicate where data is suppressed due to small cohorts.
Published 22 January 2020
Last updated 22 January 2021 + show all updates
-
Guidance updated to include new report information section, destinations data and inclusion of 2019 retention and completion and attainment measures.
-
Updated percentile boundaries data file.
-
First published.
Responses