COVID-19 pulse survey June 2020
The Institute for Apprenticeships and Technical Education opened a pulse survey on 1 June 2020. This was to get information about the impact of COVID-19 on employers, with a focus on their existing apprentices and future recruitment.
We opened a pulse survey on 1 June 2020. This was to get information about the impact of COVID-19 on employers, with a focus on their existing apprentices and future recruitment. There were 350 responses to the survey across three-weeks.
Results should be treated with caution. They are not representative of all businesses due to the sampling methods.
60% of respondents with existing apprentices said that training was still happening as distance learning.
71% of respondents with existing apprentices estimated their apprenticeship starts would decrease in April to September 2020 compared to the same time in the previous year.
RESPONSES
The online survey ran from 1 to 22 June 2020.
The target audience for the survey was employers. We reached out to employers through:
- trailblazer network (4566 contacts)
- T Level panel (212 contacts)
- Small Business Forum (12 contacts)
- third-party contacts
- social media – LinkedIn and Twitter
There were 350 responses to the survey across three weeks. Based on the direct email contacts with trailblazers, T Level panel members and the Small Business Forum members, this is a response rate of 7%. This does not consider the other types of communication, so the actual response rate will be lower. It is possible that multiple respondents are from the same organisation.
REPRESENTATION AND BIAS
Findings from the pulse survey are unweighted and should be treated with caution when used to assess the impact of COVID-19 across the economy. Each response was given the same weight regardless of size, sector and the number of apprentices they have.
There are potential biases that could impact how representative the results are, including:
- 61% of respondents had worked with the Institute before, so there is a bias towards employers known to the Institute
- 80% of respondents said their organisation employed apprentices, so there is a bias towards employers with apprentices
- there is a bias towards employers still in business and currently able to spend time filling out a survey
- some sectors had more responses than others (see Figure 1) and this does not necessarily reflect the sector size in the economy
Figure 1: The 350 responses by sector
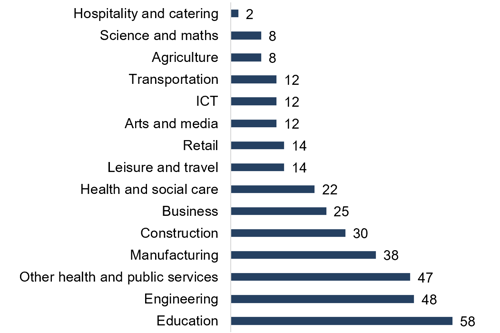
Source: Supporting table T1: responses_sector. Survey question: “Which best describes the sector of your organisation?”
In some of the tables, results are grouped as ‘other sectors’ to avoid disclosure of information about respondents, for example where the number of respondents is under five.
Even with the potential bias and small sample size, the survey gives a useful view of the experience of the 350 respondents.
FINDINGS
Current apprentices
Respondents were asked about apprentices they currently employ. There were 282 respondents who have apprentices in their organisation.
60% of these respondents said most of their apprentices have been able to continue off-the-job training as distance learning.
Table 1 shows the responses across categories. A respondent could select more than one choice, so the percentages do not add up to 100%. For example, apprentices could be furloughed and also be continuing off-the-job training.
Table 1: Responses to the question “Which of these categories apply to the majority of your apprentices?”
| CATEGORIES | NUMBER OF RESPONDENTS WHO INDICATED THIS RESPONSE | PERCENTAGE OF RESPONDENTS WHO INDICATED THIS RESPONSE |
|
Off-the-job training has continued as distance learning |
169 |
60% |
|
Off-the-job training has continued not as distance learning |
16 |
6% |
|
Registered as a break in learning |
24 |
9% |
|
Furloughed |
82 |
29% |
|
None of these apply |
39 |
14% |
|
Total respondents |
282 |
Source: Supporting table T2: current_apprentices. Survey question:” Which of these categories apply to the majority of your apprentices?”
There is a difference in responses by sector, as shown in Table 2. This counts respondents who selected “Off-the-job training has continued as distance learning” and/or “Off-the-job training has continued not as distance learning”.
The differences between sectors could be due to differences in COVID-19 impact or response bias. There are high proportions of continued learning in the ‘Other health and public services’ and ‘Education’ sectors. These have the highest number of total responses for this question (40 and 43) so will impact a lot on the overall result.
Sectors are grouped into ‘Other sectors’ where individual sector responses were too few to allow individual reporting. The other sectors for Table 2 are: Leisure and Travel; Arts and Media; ICT; Transportation; Agriculture; Science and Maths; and Hospitality and Catering.
Table 2: Sector breakdown of respondents saying the majority of their apprentices are continuing with off-the-job training
|
SECTOR |
MAJORITY OF APPRENTICES CONTINUING OFF-THE-JOB TRAINING |
BASE |
|
|
NUMBER OF RESPONDENTS WHO INDICATED THIS RESPONSE |
PERCENTAGE OF RESPONDENTS WHO INDICATED THIS RESPONSE |
||
|
Other health and public services |
31 |
78% |
40 |
|
Health and social care |
15 |
75% |
20 |
|
Education |
32 |
74% |
43 |
|
Business |
13 |
72% |
18 |
|
Retail |
8 |
62% |
13 |
|
Engineering |
23 |
61% |
38 |
|
Manufacturing |
17 |
59% |
29 |
|
Construction |
8 |
28% |
29 |
|
Other sectors |
29 |
56% |
52 |
|
All sectors |
176 |
62% |
282 |
Source: Supporting table T3: current_sector_training. Survey question:” Which of these categories apply to the majority of your apprentices?”
There is also variation by sector in the percentage of respondents saying most of their apprentices are furloughed, as shown in Table 3. In this case, the ‘Other health and public services’ and ‘Education’ sectors are at the lower end of the responses. Again, these differences should be interpreted with caution due to the potential bias.
The other sectors for Table 3 are: Health and Social Care; Arts and Media; ICT; Transportation; Agriculture; Science and Maths; and Hospitality and Catering.
Table 3: Sector breakdown of respondents saying the majority of their apprentices are furloughed
|
SECTOR |
MAJORITY OF APPRENTICES ARE FURLOUGHED |
BASE |
|
|
NUMBER OF RESPONDENTS WHO INDICATED THIS RESPONSE |
PERCENTAGE OF RESPONDENTS WHO INDICATED THIS RESPONSE |
||
|
Construction |
19 |
66% |
29 |
|
Leisure and travel |
7 |
58% |
12 |
|
Manufacturing |
13 |
45% |
29 |
|
Retail |
5 |
39% |
13 |
|
Engineering |
13 |
34% |
38 |
|
Business |
5 |
28% |
18 |
|
Education |
10 |
23% |
43 |
|
Other health and public services |
5 |
13% |
40 |
|
Other sectors |
5 |
8% |
60 |
|
All sectors |
82 |
29% |
282 |
Source: Supporting table T4: current_sector_furlough. Survey question:” Which of these categories apply to the majority of your apprentices?”
Recruitment intentions
Of the 350 respondents, 162 (46%) reported being part of a small or medium-size enterprise (SME) and 188 (54%) from a large business with over 250 employees.
As shown in Figure 2, respondents from large businesses had more certainty about the next year, with 76% believing they would have an apprentice start at their organisation before May 2021.
Nearly half of respondents from SMEs said they could not tell at this time when the next apprenticeship start would be at their organisation or they have no intention to recruit in future.
Figure 2: Predicted next apprenticeship start by business size
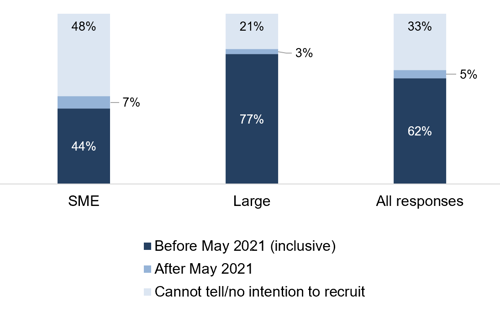
Source: Supporting table T5: next_start. Survey question: “When do you think you will next have an apprenticeship start at your organisation (including existing and new employees)?”
Respondents also answered how many apprentices they had started training between April and September (inclusive) in 2019. They also estimated how many they would start in the same period in 2020.
This measure only counts responses where they answered both questions and had recruited an apprentice in 2019. This gives 172 responses. The results, as seen in Figure 3, show 71% of respondents estimated a decrease in apprenticeship recruitment.
There were 19 respondents (11%) expecting an increase in apprenticeship starts compared to last year.
The survey took place before the announcement on 8 July 2020 of payments to employers for recruiting new apprentices, which will be introduced for 6 months from August 2020, therefore intentions to recruit may be different now.
Figure 3: Estimated change in apprenticeship starts comparing April to September (inclusive) in 2019 to the same period in 2020
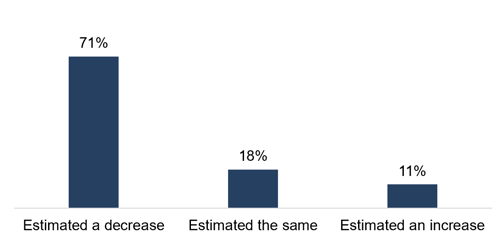
Source: Supporting table T6: estimated_recruitment. Survey questions: “How many apprentices started at your organisation from April to September 2019 (inclusive); “How may apprentices do you think will start at your organisation from April to September 2020 (inclusive)?”
NEXT STEPS
Survey findings will be used by the Institute to inform COVID-19 work and this published summary will be shared with the Department for Education and Education Skills Funding Agency.
We intend to run more pulse surveys in future to gain further employer feedback about the support needed and challenges faced because of COVID-19.
For future pulse surveys, we will look at ways to improve the number of responses and representation. There will be efforts to reach respondents across sectors.
Responses