Primary inspection data summary report (IDSR) guide
This guide gives an overview of the data contained in the primary inspection data summary report (IDSR) and information to help interpret the charts.
Overview of the IDSR: primary
This guide is currently only for primary IDSRs. We will add secondary-specific guidance to coincide with the release of the secondary IDSR.
The IDSR is a PDF file showing data for Ofsted inspectors to use when preparing for and during inspection. The IDSR is designed to align with our school inspection handbook, so that areas of interest can be used to identify inspection trails.
The IDSR has its own dedicated area in the Department for Education (DfE)’s DfE Sign-in. Within this, schools can access their IDSR through the DfE’s Analyse School Performance (ASP) area. Click on ‘All reports’ and then on ‘Inspection data summary reports’ and there is a link to the IDSR. Schools can download and save their IDSR.
IDSR 2019
We have re-developed the IDSR following the introduction of the new education inspection framework (EIF). The 2019 IDSR contains fewer charts and is reduced in size. The new IDSR has been designed to:
- reduce the time spent preparing for an inspection
- provide interpretation of the data for inspectors
- minimise the focus on small groups that distract the conversation away from meeting the needs of all pupils
The IDSR continues to contain areas of interest sentences to highlight important data trends and differences from national data. Existing contextual information remains but is presented in the charts that were in the 2017 IDSR.
The new IDSR contains:
- new contextual information including workforce census data, financial data, multi-academy trust (MAT) and local authority information and school links
- new subject attainment sentences at key stage 4 to highlight potential subject areas to focus on
- new attainment trend charts
- a re-structured primary report to focus on subjects across the school, such as reading/literacy
- a reduced focus on pupil group performance
- expanded destinations data, to include breakdown of pupil destinations for the past 3 years
The school details information on the front page comes from the DfE’s ‘Get information about schools (GIAS)’ service.
You can find further detailed guidance in our IDSR collection on GOV.UK.
School details box
The school details information on the front page comes from GIAS service produced by the DfE.
Areas of interest: explained
The ‘areas of interest’ in the IDSR are sentences providing inspectors with interpretation of a school’s historical data. A sentence may be ‘triggered’ by high or low performance, either across 3 years, 2 years or in the latest year. Similarly, we generate sentences for absences and exclusions where data is particularly high or low. Some sentences describe the data, such as those relating to the reasons for permanent exclusions.
A sentence shown in grey may also appear when the school’s data is not high or low, for example, if progress scores are not statistically significant. These are included to show inspectors that the data has been analysed but that the historical data is not an area of interest.
Sentences are not produced when the cohorts are very small, namely cohorts of 10 or fewer. Sentences about permanent exclusions will appear for every school, regardless of cohort size.
School are ranked against other maintained mainstream schools with a valid school level value. For some measures, ranking has not been possible because there are not enough distinct values to yield adequate ranks (1–100).
Key stage 2 progress: reading, writing and mathematics
There can be multiple sentences under each heading if your school fits the criteria of each sentence.
Each sentence outlined below will only appear if they have ‘triggered’ for your school.
Low or high performance
These sentences show where there is consistently high or low performance for progress in reading, writing or mathematics, based on statistical significance tests and percentile rank. Sentences will flag if the progress score for all pupils is in the bottom or top quintile for the latest 3 or 2 years and the score is significantly different to the national score. This is based on the distribution of scores for all pupils and where cohorts are 10 or more for each of the years. The progress score for the latest year is in brackets. If the latest 3 years sentence is not flagged, a sentence will appear if the all pupil group is in the bottom/top quintile for the latest 2 years.
If these sentences are not flagged for the latest 3 or 2 years, sentences will flag when there is high or low attainment in the latest year.
Example sentences
Key stage 2 progress in reading (-5.1) was significantly below average and in the lowest 20% of all schools in 2017, 2018 and 2019.
Key stage 2 progress in reading (-4.9) was significantly below national and in the lowest 20% of all schools in 2019 as well as in 2018.
Key stage 2 progress in reading (-5.4) was significantly below average and in the lowest 20% of all schools in 2019.
Progress trend analysis
A sentence shows when there has been a fall or increase in progress score. This sentence will flag when there was a drop or increase between 2017 and 2018, or 2018 and 2019. This will align with arrows shown on the progress trend charts.
Progress is a relative measure, and the national average will always be very close to 0. Progress scores are not directly comparable year on year as they do not compare the cohorts with each other. For example, if all the pupils in 2019 generally made more progress than those in 2018, a comparison of progress scores would not show this improvement.
To allow for direct comparisons, every progress score is standardised using the formula shown in the appendix. A sentence will appear if the standardised score has changed by more than 1 and the quintile position has changed by more than 1.
Example sentence
Reading progress has improved between 2018 and 2019.
Attainment: reading, writing and mathematics
There can be multiple sentences under each heading if your school fits the criteria of each sentence.
Each sentence outlined below will only appear if they have ‘triggered’ for your school.
Key stage 2 attainment
A sentence will flag when there is consistently high or low attainment of the expected standard for each subject for the latest 3 or 2 years, based on statistical significance and percentile rank.
Example sentence
Key stage 2 attainment of the expected standard (100+) in mathematics (39%) was significantly below national and in the lowest 20% of all schools in 2019 as well in 2018 and 2017.
A different sentence will appear when there is consistently significant high or low attainment of the high standard in reading or mathematics. A sentence will also show when there is consistently significant high or low attainment of greater depth in writing.
Example sentence
Key stage 2 attainment of the high standard (110+) in reading (2%) was significantly below national in the lowest 20% of all schools in 2019 as well as in 2018 and 2017.
If both the expected standard and high/greater depth sentence flag for both consistently high or low attainment for the same subject, the sentence will be combined.
If these sentences are not flagged for the latest 3 or 2 years, sentences will flag when there is high or low attainment in the latest year.
Key stage 2 attainment 3-year average
A sentence will appear for reading and mathematics when the 3-year combined average key stage 2 attainment score was in the highest or lowest 20% of all schools.
Example sentence
The 3-year average reading attainment score (102.1) was in the lowest 20%.
Key stage 1 attainment
A sentence will flag when there is consistently significant low attainment of the expected standard for each subject for the latest 3 or 2 years, based on statistical significance and percentile rank.
Example sentence
Key stage 1 attainment of the expected standard (30%) in reading was significantly below national and in the lowest 20% of all schools in 2019 as well as 2018 and 2017.
A different sentence will flag if there is consistently low attainment of greater depth for each subject.
Example sentence
Key stage 1 attainment of greater depth (3%) in reading was significantly below national in the lowest 20% of all schools in 2019 as well as 2018 and 2017.
If both the expected standard and greater depth sentence flag for both consistently significant high or low attainment for the same subject, the sentence will be combined.
If these sentences are not flagged for the latest 3 or 2 years, sentences will appear when there is high or low attainment in the latest year.
Other measures in 2019
There can be multiple sentences under each heading if your school fits the criteria of each sentence.
Each sentence outlined below will only appear if they have ‘triggered’ for your school.
Key stage 2: attainment of the expected standard for combined subjects
A sentence is generated based on the proportion of pupils that reached the expected/higher standard in reading, writing and mathematics combined over the latest 3 years. A school can have a sentence triggered for the latest year only, the latest year and previous year, or all 3 years.
The criteria that trigger this sentence require that a school is in the top or bottom 20% of all schools and either significantly above or below the national.
Example sentence
In 2019, 36% of pupils achieved the key stage 2 expected standard in reading, writing and mathematics, significantly below national and in the lowest 20% of all schools. Two per cent of pupils achieved the high standard, which is significantly below the national and in the lowest 20% of all schools.
English grammar, punctuation and spelling test
A sentence is generated based on the proportion of pupils that achieved the expected (100+)/higher (110+) standard in the latest year. The lowest scaled score is 80 and the highest scaled score is 120. Pupils scoring at least a scaled score of 100 will have met the expected standard of the test.
The criteria that trigger this sentence require that a school is in the top or bottom 20% of all schools and either significantly above or below the national.
Example sentence
In 2019, 38% of pupils achieved a scaled score of 100+ in the English grammar, punctuation and spelling test, significantly below national and in the lowest 20% of all schools.
Science
The key stage 2 science sentence is generated based on the proportion of pupils that reached the expected standard over the latest 3 years. A school can have a sentence triggered for the latest year only, the latest year and previous year, or all 3 years.
Example sentence
In 2019, 56% of pupils achieved the key stage 2 science expected standard, significantly below national and in the lowest 20% of all schools.
Early years foundation stage
A sentence is generated based on the proportion of pupils that achieved a good level of development in the latest year. Children achieving a good level of development are those achieving at least the expected level in these areas of learning:
- communication and language
- physical development
- personal, social and emotional development
- literacy
- mathematics
Example sentence
In 2019, the percentage achieving a good level of development in the early years foundation stage (47%) was significantly below national and in the lowest 20% of all schools.
Absence
Absence data is based on 3 terms for 2018, 2017 and 2016. View further information on absence statistics.
Absence data is in all IDSRs by December each year. This is because 2019 data is only provided to Ofsted after the primary IDSR release.
Sentences will appear comparing the rate of overall absence in the latest year with the national average for similar schools. Similar here means the same phase of education and with a similar level of deprivation (in the same income deprivation affecting children index (IDACI) quintile).
Example sentence
In 2017/18, the rate of overall absence (5.40%) was slightly above the national average for schools with a similar level of deprivation (5.39%).
A sentence is generated when the rate of overall absence was in the highest or lowest 10% in each of the last 2 or 3 years.
Example sentences
Overall absence was high (in the highest 10%) for the latest 3 years for all pupils.
Overall absence was low (in the lowest 10%) for the latest 2 years for all pupils.
Exclusions
For fixed-period exclusions, ‘total’ relates to the number of pupils who had 1 or more fixed-period exclusions during the academic year. ‘Repeat’ relates to the number of pupils who had 2 or more fixed-period exclusions.
The rate of total or repeat fixed-period exclusions is calculated by dividing the number of pupils excluded by the number on roll. We have profiled the national comparator for all fixed-period exclusions by phase of education. Special schools are compared with the national rate for secondary schools.
The number of pupils with a permanent exclusion is provided for up to the last 3 years. The national average, profiled by phase of education, is included for the latest year. Special schools are compared with the national average for special schools.
The numbers and proportions of pupils with fixed-period or permanent exclusions are often very small. These should be interpreted with caution, particularly when making comparisons over time. The permanent and fixed-period exclusions data is one year behind. For example, 2017/18 exclusions data was published in July 2019. Exclusions data is for cohorts before the one shown on the context page and the number on roll may have changed.
Further information on exclusions statistics is in the DfE’s exclusions statistics guide.
Fixed-period exclusions
A sentence shows when there are high proportions of total/repeat fixed-period exclusions for up to 3 years. A high proportion relates to the highest quintile based on the national distribution of exclusion proportions. This is profiled by phase and year, and only includes schools with cohorts greater than 10 in that year. Special schools are compared with the distribution for secondary schools. The sentence includes the school’s proportion of total/repeat fixed-period exclusions for the latest year is in brackets. If a sentence is not triggered for the latest 3 years, it will also show if the school is in the highest quintile for the latest 2 years. If a sentence is not triggered for the latest 3 or 2 years, it would show a sentence if the school is in the highest quintile in the latest year.
Example sentences
The rate of total fixed-period exclusions (6.75%) was in the highest 20% in 2017/18 as well as in 2016/17.
The rate of repeat fixed-period exclusions (4.38%) was in the highest 20% in 2017/18.
For schools with at least 1 pupil with a fixed-period exclusion in 2017/18, a sentence details the prevalence of repeat fixed-period exclusions. For schools with between 1 and 10 pupils receiving a fixed-period exclusion, the sentence states how many received more than one. If any pupils received more than one, the sentence also states how many received 10 or more. The same applies to schools with more than 10 pupils receiving a fixed-period exclusion. However, the sentence quotes proportions rather than numbers of pupils.
Example sentences
Of the 7 pupils with at least one fixed-period exclusion in 2017/18, 4 were excluded on more than one occasion and 1 received 10 or more fixed-period exclusions during the year.
Of the 56 pupils with at least one fixed-period exclusion in 2017/18, 34% were excluded on more than one occasion and 10.7% received 10 or more fixed-period exclusions during the year.
For schools with at least 1 pupil with a fixed-period exclusion in 2017/18, a sentence states the most common reason and its frequency. It also includes the total number of fixed-period exclusions and any other reasons accounting for 10% or more of the total, with their frequency.
Example sentence
Of the 13 fixed period exclusions in 2017/18, 5 were for verbal abuse/threatening behaviour against a pupil. Other reasons that accounted for more than 10% of fixed period exclusions in 2017/18 were: racist abuse (3); physical assault against an adult (2).
Permanent exclusions
A sentence appears for each school stating the number of permanent exclusions in each of the last 3 years, if data is available. The sentence includes the national average for the latest year, profiled by phase.
Example sentences
There was 1 permanent exclusion in 2017/18. The national average for this year was close to zero. There were none in 2016/17 but there were 2 in 2015/16.
For schools with at least 1 pupil who received a permanent exclusion, a sentence states the most common reason and its frequency. It also includes the total number of permanent exclusions and any other reasons for permanent exclusions, with their frequency.
Example sentence
Of the 2 permanent exclusions in 2017/18, both were for theft.
Pupil groups
Pupil group differences can be meaningless when analysed at school level, particularly where groups relate to small cohorts. The conversation should be about meeting the needs of all pupils.
As such, sentences related to the performance of pupil groups will only appear when:
- the performance of the group differs from that of the whole school
- the pupil groups are disadvantaged pupils, low prior attainers, middle prior attainers and high prior attainers
- performance relates to key stage 2 progress and attainment, or key stage 1 attainment
If performance does not differ from that of the school, no sentences will appear.
Key stage 1 prior attainment groups are based on emerging, expected and exceeding in reading, writing or mathematics early learning goals.
Note that:
- it was not possible to produce percentile ranks for groups in terms of attainment at key stage 1 and 2; this is due to the spread of data and, therefore, only statistical significance tests have been performed to identify high or low performance
- due to small cohorts of low and high prior attainment groups, it is much less likely for sentences to appear
- pupil group sentences for absence and exclusions will be incorporated in future releases
School and local context
School level
The chart shows school-level information, based on the January school census, for 2017, 2018 and 2019 for the following measures:
- the percentage of pupils in receipt of free school meals (FSM) at the time of the January census; these pupils are those who are/have been, eligible for FSM and have claimed them some time in the last 6 years (Reception to Year 11)
- the percentage of pupils whose first language is not English or believed to be other than English
- the percentage of pupils with special educational needs and/or disabilities (SEND) who do not have an education, health and care (EHC) plan (SEND support)
- the percentage of pupils with SEND and who have a statement of SEND or EHC plan
- the number of pupils on roll
Stability is a measure of the percentage of students who were admitted to the school at the standard time of admission. The stability percentage is calculated by dividing pupils considered stable by all eligible pupils (pupils in Years 1 to 11 and with current single or current main dual registration at the school).
For each group, school figures along with the national will show for each year. The quintile boxes compare the latest year to the national distribution for all schools. Special schools are compared with secondary school nationals.
MAT and local authority information
This section provides information about the MAT or local authority that the school is part of. For example, if a school is part of a MAT it will have information about the number of schools in the MAT and the latest overall effectiveness grades of the schools within the MATs. Similarly, it will show local authority information for local authority maintained schools.
It is important to note that the latest inspection grades may include grades of the school before joining the MAT. Between November 2017 and January 2018, we consulted on changes to our official statistics and management information.
As a result of this consultation, we changed the way we show and report on the latest inspection of all providers. We now include the grades from the predecessor schools for schools that have not yet been inspected in their current form. This provides a more comprehensive view of the sector. For more details of the changes, see the official statistics documents.
School workforce
This section provides information about the school workforce at November 2018, based on published DfE school workforce data.
It provides information on:
- the proportion of teachers with at least 1 period of sickness absence compared with national average
- the average number of days lost to teacher sickness absence compared with national average
- the number of full-time vacant teacher posts in the school
Ethnicity
Ethnicity information comes from the January 2019 school census. The sentence states how many ethnic groups are present in the school out of 17.
The 17 possible ethnic groups are:
- White British
- White Irish
- White Traveller of Irish Heritage
- White Gypsy/Roma
- White Any other White background
- Mixed White and Black Caribbean
- Mixed White and Black African
- Mixed White and Asian
- Mixed Any other Mixed background
- Asian or Asian British Indian
- Asian or Asian British Pakistani
- Asian or Asian British Bangladeshi
- Asian or Asian British Any other Asian background
- Black or Black British Caribbean
- Black or Black British African
- Black or Black British Any other Black background
- Chinese
This excludes the groups ‘Any other ethnic group’, ‘Parent/pupil preferred not to say’ and ‘Ethnicity not known’.
The sentence also states the largest 5 ethnic groups with more than 5% present in the school.
Local area
The local area section provides information about the level of deprivation in the local area in which the school resides, together with an aggregated pupil-derived deprivation indicator. Each deprivation indicator is based on the IDACI.
The IDACI measures the proportion of all children aged 0 to 15 living in income-deprived families. It is a subset of the income deprivation domain, which measures the proportion of the population in an area experiencing deprivation relating to low income. The definition of low income used includes both those people who are out of work and those who are in work but who have low earnings and who satisfy the respective means tests.
Example sentence
The school location deprivation indicator was in quintile 2 (most deprived) of all schools. The pupil base is in quintile 4 (least deprived) of all schools in terms of deprivation.
The sentences display what quintile the deprivation level falls under. Each quintile represents a bound of 20%. The higher the quintile the greater the level of deprivation.
A school’s local area is based on the lower layer super output area (LSOA) in which it resides. LSOAs are a geographic hierarchy designed to improve the reporting of small area statistics in England and Wales.
You can read further information about the data used for the local area deprivation.
Finance
The IDSR now contains the financial information for 2017/18, including:
- the level of funding compared with the national average for the school phase
- the in-year balance and how this compares with the previous year
- the spend per pupil and how this compares with the previous year
Year group context
Characteristics
The chart shows school-level year group characteristics, based on the 2019 January school census for the following measures:
- number on roll
- low prior attainment for reading, writing and mathematics
- middle prior attainment for reading, writing and mathematics
- high prior attainment for reading, writing and mathematics
- the percentage of pupils in receipt of FSM at the time of the January census; these pupils are those who are or have been eligible for FSM and have claimed them some time in the last 6 years (Reception to Year 11)
- the percentage of pupils who speak English as an additional language
Shading on the chart indicates where the year group was different to other year groups in the school.
Prior attainment
The prior attainment table presents how pupils in school performed at the previous key stage in relation to their year group.
We have based prior attainment:
- in reading and in writing for Years 1 and 2 on the percentage of pupils who achieved at least the expected level in the early years foundation stage profile early learning goal
- in mathematics for Years 1 and 2 on the percentage who achieved at least the expected level in both of the mathematics early learning goals
- for Years 3, 4 and 5 on the percentage who achieved at least the expected standard at key stage 1
- for Year 6 on the points equivalent to whole levels
Shading indicates whether the pupils in this school were above or below national. If pupils were in line with national, a dash is shown. If the number of pupils was 10 or below, an ‘X’ is shown.
SEND characteristics
There is a formal assessment to decide if a pupil needs a statement of SEND or an education, health and care (EHC) plan.
Special educational needs (SEN) support is the help a school gives pupils that falls outside the usual curriculum. Outside specialists can tell or support the class teacher and SEN coordinator.
An EHC plan is for children and young people aged up to 25 who need more support. This extra help is not available through SEN support. EHC plans identify educational, health and social needs and set out the support to meet those needs.
The spring census of 2019 provides data for this table. The table displays the number of pupils in the school who have a SEND need and what the need category is. The 2 halves of the table represent pupils who have SEND support and pupils who have an EHC plan.
It also shows what year the pupil is in. It flags if the school has a SEND unit and how many pupils out of all those with SEND are also disadvantaged.
SEND units are special provisions within a mainstream school. These units contain separate classes to teach pupils with SEND. These units:
- receive extra funding from the local authority
- cater for a specific type or types of SEND (for example, autistic spectrum disorders)
- are usually for pupils with statements or EHC plans (but this is not required)
Pupils may be defined as disadvantaged if they:
- have been eligible for FSM in the past 6 years
- need supervision at least once a day
- have been adopted from care
Resourced provision refers to the places reserved at a mainstream school for specific pupils with SEND. The pupils learn within mainstream classes but require some specialist facilities.
Resourced provision:
- receives extra funding from the local authority
- caters for a specific type or types of SEN, for example specific learning difficulties
- is usually for pupils with statements or EHC plans, but this is not required
Progress and attainment trend
Reading, writing and mathematics three-year trend
This section shows how the school has performed compared with other schools nationally overall and for each element over the last 3 years, regardless of the methodology at the time. There is a clear indication of the position in terms of the quintile, where each quintile represents 20% of schools. Red boxes will indicate where a figure was, statistically, significantly below the national average. Green boxes will indicate where a figure was, statistically, significantly above the national average. As in the rest of the report, figures are displayed in grey when they are based on 10 or fewer pupils. Also, no statistical significance will show for cohorts of 10 or fewer pupils.
The arrows indicate an increase or decrease in progress score. These align with the progress trend analysis. We have only made comparisons between 2017–18, and 2018–19. The calculation that underpins these is shown in the appendix.
Understanding the data in the primary IDSR
Statistical significance
Assessment data and information are starting points for inspectors’ discussion with schools. Statistical significance testing is used in the IDSR to draw attention to noteworthy values. These values show where differences in school’s performance may be due to more than chance variation. The IDSR uses percentile ranking as well as statistical significance testing. This allows us to look at relative performance across time while also highlighting noteworthy changes.
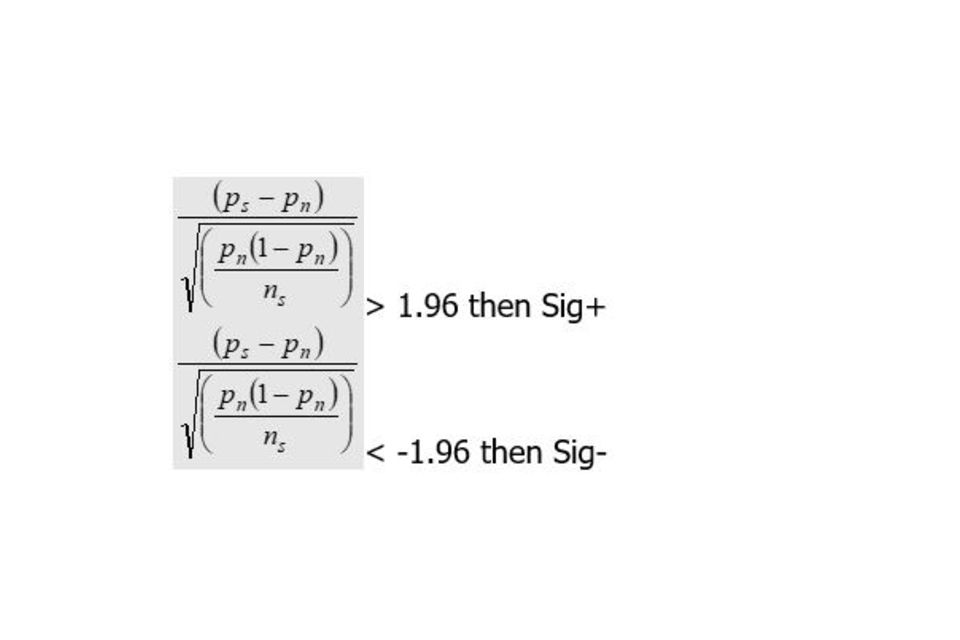
Significance calculation for threshold measures
A normal approximation to the binomial distribution is used to identify statistically significant differences between proportions of pupils (shown in the areas of interest).To ensure that the normal approximation to the binomial distribution test is statistically valid, the distribution of scaled scores must be approximately normally distributed. This can be ensured by having a roughly symmetrical distribution and/or a large enough cohort. The common rule of thumb is that both:
nP
and
n(1-P)
are greater than or equal to 5.
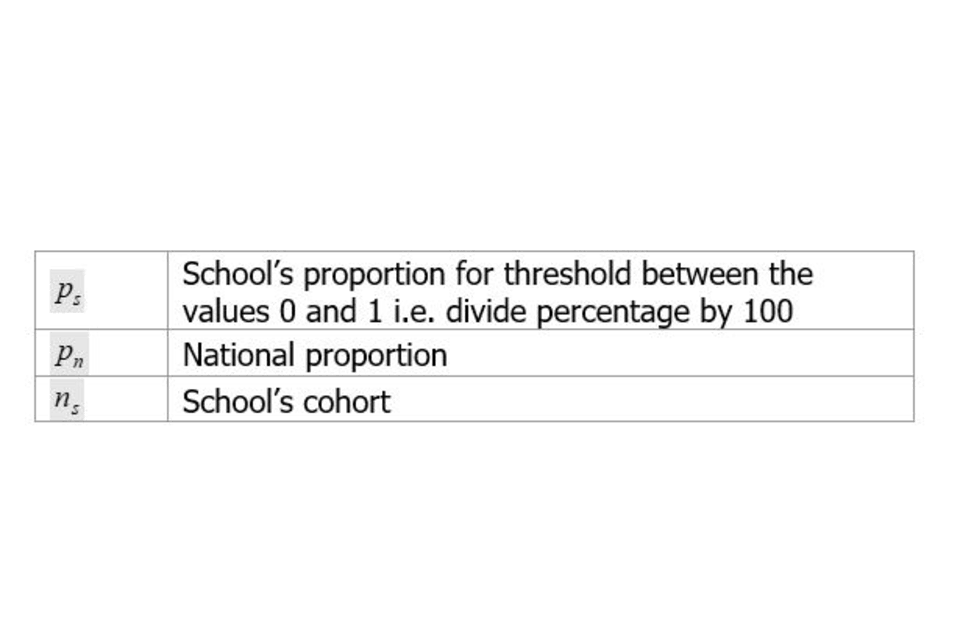
Where:
- P represents the national average of pupils reaching the expected standard
- n represents the total number of pupils
The calculation is as follows:
Otherwise not statistically significant.
Where:
This methodology is applied to the following performance measures:
- key stage 2 expected standard thresholds
- key stage 1 expected standard thresholds
- Year 1 phonics
- destinations
Progress trend analysis calculation
Progress is a within year, norm referenced measure. Scores are not directly comparable year on year. To allow for direct comparisons across years, every progress score is standardised using the following formula:
(Progress score – mean) / standard deviation
Absence and exclusions
Absence data is in all IDSRs by December each year. This is because data is only provided to Ofsted after the primary IDSR release.
The permanent and fixed-period exclusions data is 1 year behind. For example, 2017/18 exclusions data was published in July 2019. Exclusions data is for cohorts before the one shown on the context page and the number on roll may have changed.
For absence and fixed-period exclusions, special schools are compared to the national for secondary schools. For permanent exclusions, special schools are compared to the national average for special schools.
Data sources
All data in the IDSR is from the DfE. We use the data to calculate school-, local-authority- and national-level data. Pupil-level data is anonymous and does not contain names or addresses. It is not shared with inspectors at any point.
We receive the following data sets from the DfE to produce the IDSR.
National pupil database:
- key stage 1 and phonics
- school census to populate contextual sections
- early years foundation stage profile (EYFSP)
- ASP all key stages
Performance tables:
- school and college database (SCDB) primary and secondary
- key stage 2
- key stage 4
- key stage 5
- level 3 value added
Absence and exclusions data:
- school-level exclusions
- 2-term absence
- 3-term absence
You can find more information on the accountability measures in these DfE guidance documents:
- primary school accountability
- secondary accountability measures (including Progress 8 and Attainment 8)
Special schools and pupils with special educational needs and disabilities
An IDSR is produced for special schools. However, it may contain very little information about the performance of pupils.
Pupils with SEND are a diverse group with differing needs and expectations. Therefore, the IDSR will no longer display any averages for this group.
Contextual information is provided for the group, including the breakdown of the number of pupils with SEND by primary special educational need.
Junior and middle schools
A standard sentence appears to explain that junior and middle schools have lower progress scores on average. Also, due to the age range of pupils at middle schools, pupils will have only attended a middle school for a short time before they take their key stage 2 tests.
Inspectors should be aware of this and, as with any inspection, carefully consider a range of information and data.
Missing data
There are a few possible reasons why data for some years is not shown for a particular measure.
In charts and tables, data may not be shown for some years because:
- the measure did not exist, was defined differently or was not available to Ofsted for that year; if this is the case, the data is shown as a dash
- the school had no pupils for a particular measure in that year; if this is the case, the cohort will be shown as a 0 and a dash will be shown for the measure
- if the school recently changed legal status, for example from a local authority maintained school to a sponsor-led academy, the data may be shown under the predecessor school name or unique reference number (URN) in ASP
National figures
The national figures may differ from the figures published in the DfE performance tables and ASP. This is due to the varying decimal precisions used between organisations.
The disadvantaged pupil group is compared to the national for pupils who are not disadvantaged.
Prior attainment pupil groups are compared to their respective pupil group nationally.
Cohorts and numbers of pupils included
Cohorts display the total number of pupils based on the group and year of the measure presented.
For measures where all pupils were entered, the cohort shows the number of pupils the measure is based on. For some measures, it is used as the denominator for percentages.
If there have been any leavers and joiners, then the cohort number shown on progress and attainment data may not match the context section. The context section is a snapshot of the day the school census is taken in January of that year.
The ‘number of pupils included’ on progress pages only includes pupils with prior attainment information.
Published 7 October 2019 Contents


Responses